Operations | Monitoring | ITSM | DevOps | Cloud
Elasticsearch Vulnerability: How to Remediate the most recent Issues
An Elastic Security Advisory (ESA) is a notice from Elastic to its users of a new Elasticsearch vulnerability. The vendor assigns both a CVE and an ESA identifier to each advisory along with a summary and remediation details. When Elastic receives an issue, they evaluate it and, if the vendor decides it is a vulnerability, work to fix it before releasing a remediation in a timeframe that matches the severity.
Machine learning log analysis and why you need it
Your log analysis solution works through millions of lines of logs, which makes implementing a machine learning solution essential. Organizations are turning to machine learning log alerts as a replacement or enhancement of their traditional threshold alerts. As service uptime becomes a key differentiator, threshold alerts are only as good as your ability to foresee an issue.
Strategically Managing Cloud Resources for Security, Fun, and Profit
The first time I created a cloud compute instance, then still called a “Cloud VM”, was an almost transcendent moment. It was like magic. I was at my first organization which had adopted the cloud, in my first DevOps position, and I immediately knew that the world had changed.
The Cloud Network Security Gap
Before we dive into the gap in cloud network security, let’s take a step back. If you’ve been in Operations for a while, you might remember how it used to be. “Network” was a team. When you needed to open a port on the network, you had to provide an exhaustive definition of the change, explaining what port you needed, what external addresses should be able to reach it, and where it should be routed to internally.
Improve Elasticsearch Query Performance with Profiling and Slow Logs
If our end users end up too long for a query to return results due to Elasticsearch query performance issues, it can often lead to frustration. Slow queries can affect the search performance of an ecommerce site or a Business Intelligence dashboard – either way, this could lead to negative business consequences. So it’s important to know how to monitor the speed of search queries, diagnose and debug to improve search performance.
Writing Effective Snort Rules with Examples [Best Practices]
This post will help you write effective Snort Rules to materially improve your security posture. We’ll begin with a breakdown of how a Rule is constructed and then explore best practices with examples in order to capture as many malicious activities as possible while using as few rules as possible. Snort is an open-source network intrusion detection system (NIDS) that provides real-time packet analysis and is part of the Coralogix STA solution.
Are your log insights as powerful as they could be?
Surveys show that developers spend roughly 25% of their time troubleshooting issues, amounting to over one working day per week! Let’s examine the solutions that will guide your developers to the log insights they need to efficiently troubleshoot issues.
Elasticsearch Release: Roundup of Changes in 7.9.2
The latest Elasticsearch release version was made available on September 24, 2020 and contains several bug fixes and new features from the previous minor version released this past August. This article highlights some of the crucial bug fixes and enhancements made, discusses issues common to upgrading to this new minor version and introduces some of the new features released with 7.9 and its subsequent patches. A complete list of release notes can be found on the elastic website.
Coralogix is recognized by Gartner as a Cool Vendor in Performance Analysis
As the leading log management and analytics platform, we’re proud to announce that we’ve been recognized in the Gartner “2020 Cool Vendors in Performance Analysis” report by Padraig Byrne. Gartner, Inc. is the world’s leading information technology research and advisory company. They offer world-class, objective insights on a wide variety of IT solutions.
Exciting new features of Coralogix STA
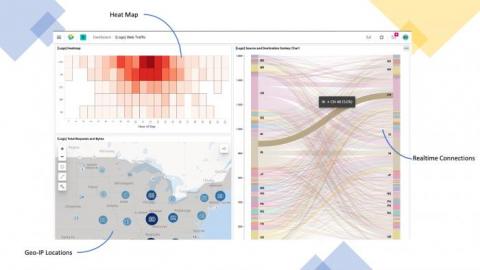
We at Coralogix, believe that cloud security is not a “nice-to-have” feature – something that only large organizations can benefit from or are entitled to have. We believe it’s a basic need that should be solved for organizations of any shape and size. This is why we built the Coralogix Security Traffic Analyzer (STA) tool for packet sniffing and automated analysis. Today we’re announcing several new features to our security product you’ll find interesting.
CI/CD Tutorial: How to deploy an AWS Jenkins Pipeline
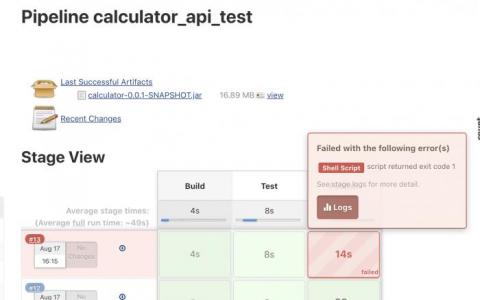
In the previous article, we have created the Continuous Integration (CI) pipeline for a simple Java application. It is now time to start working on the Continuous Deployment (CD) pipeline that will take the Java application and deploy it to AWS. To build the CD pipeline, we will extend the existing AWS Jenkins pipeline. If you have missed the previous article on building a CI pipeline for a Java application using Jenkins, make sure you read that first before continuing.
Is your logging ready for the future?
Log scaling is something that should be top of mind for organizations seeking to future-proof their logging solutions. Logging requirements will grow through use, particularly if not maintained or utilized effectively. There are barriers to successful log scaling, and in this post we’ll be discussing storage volume problems; increased load on the ELK stack, the amount of ‘noise’ generated by a growing ELK stack, and the pains of managing burgeoning clusters of nodes.
Monitoring Jenkins: Essential Jenkins Logs to Watch Out For
Monitoring Jenkins is a serious challenge. Logging is often overlooked, but it provides a wealth of information about the health of your Jenkins instance. The following are some approaches to generating informative logging to these issues, that can help to monitor and provide suitable explanations of where the problems lie; even identifying what the possible solutions are.
Kibana Dashboard Tutorial: Spice up your Kibana Dashboards
When it comes to dashboarding, Kibana is king. Since its release Kibana has changed the way businesses visualize data. Kibana is a fairly intuitive platform and offers some seriously impressive ways to visualize data. In this kibana dashboard tutorial, we are going to help you unlock the full potential of the platform and help you become a Kibana guru. When it comes to visualizing data Kibana is well suited for monitoring logs, application monitoring, and operational intelligence.
Elasticsearch Autocomplete with Search-as-you-type
You may have noticed how on sites like Google you get suggestions as you type. With every letter you add, the suggestions are improved, predicting the query that you want to search for. Achieving Elasticsearch autocomplete functionality is facilitated by the search_as_you_type field datatype. This datatype makes what was previously a very challenging effort remarkably easy.
Instana & Coralogix: Reasons You're Failing at Observability and What to Do About It
How to automate VPC Mirroring for Coralogix STA
After installing the Coralogix Security Traffic Analyzer (STA) and choosing a mirroring strategy suitable for your organization needs (if not, you can start by reading this) the next step would be to set the mirroring configuration in AWS.
AWS Elasticsearch Pricing: Getting Cost Effective Logging as You Scale
AWS Elasticsearch is a common provider of managed ELK clusters., but does the AWS Elasticsearch pricing really scale? It offers a halfway solution for building it yourself and SaaS. For this, you would expect to see lower costs than a full-blown SaaS solution, however, the story is more complex than that.
Uptime Monitoring with Heartbeat
Whenever you build a service and expose a set of endpoints to provide API access to that service, you’ll likely need to track their availability and response times, aside from ensuring their functionality. But to actually know that “something is down” or just “not performing” you need to consistently monitor your services day in day out and that’s how Heartbeat from the Elastic Beat family helps you with Uptime Monitoring.
Kibana Lens Tutorial: Easily Create Stunning Visualizations
Millions of people already use Kibana for a wide range of purposes, but it was still a challenge for the average business user to quickly learn. Visualizations often require quite a bit of experimentation and several iterations to get the results “just right” and this Kibana Lens tutorial will get you started quickly.


