Kubernetes is THE buzzword these days. Almost every IT organization is currently using it or is in the process of implementing it as part of their infrastructure. The transition to Kubernetes is complicated, whether a company is using an on-premises, cloud, hybrid, or managed solution, and it usually involves other changes in the codebase, such as shifting to a microservices architecture. While the implementation phase is led by the DevOps team, it requires the participation of the whole R&D group.
Kubernetes is one of the most advanced orchestration tools that currently exists in the software world. It provides out-of-the-box automation for environment maintenance and simplifies deployment and upgrade processes. It has different implementation types (on-premise, cloud-managed, hybrid, and more), multiple open-source supporting tools, and supports a wide range of configuration options.
Monitoring systems gather and log a wide range of performance data on a diverse range of targets—from applications to user experience, networks, servers, and more. Usually, monitoring is conducted under runtime conditions, but synthetic monitoring can also be used to simulate loads and test the resilience of web services, for example.
Complex problems can often be solved with simple, practical solutions. That’s what our team at Kenshoo discovered when we realized that we needed a way to easily and proactively track specific log messages which indicate mission-critical events.
Secrets, i.e. passwords, API keys, certificates, and any other type of credential used for digital authentication, have exploded in number and type. Even small-sized organizations might have thousands of SSH keys for example. Secrets are also a common security weakness often exploited by attackers.
Logs have been around since the advent of computers and have probably not changed all too much since. What has changed, however, are the applications and systems generating them. Modern architectures — i.e. software and the infrastructure they are deployed on, have undergone vast changes over the past decade or so with the move to cloud computing and distributed environments.
With the emergence of Amazon Web Services (AWS) in 2002, the Infrastructure as a Service (IaaS) model kickstarted the public cloud revolution that has permanently changed how IT services are deployed and delivered. According to Gartner’s July 2019 Magic Quadrant for Cloud Infrastructure as a Service report, the annual cloud IaaS market is currently worth $41.4 billion and is expected to grow to $81.5 billion by 2022.
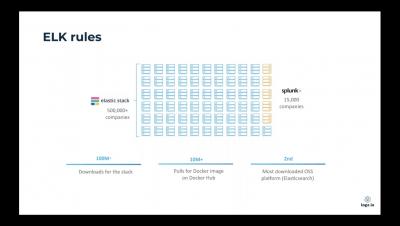
Elasticsearch is a powerful distributed search engine that has, over the years, grown into a more general-purpose NoSQL storage and analytics tool. The recent release of Elasticsearch 7 added many improvements to the way Elasticsearch works. It also formalized support for various applications including machine learning, security information and event management (SIEM), and maps, among others, through a revamped Kibana.
All engineering teams strive to build the best product they can as quickly as possible. Some, though, stumble into a false dichotomy of choosing between speed and quality. While that choice may have been necessary in the past, it’s not the case today. What I’d like to do in this article is explain why.
We hope you guys managed to rest over the summer because we sure didn’t. Our engineering team has been working hard on developing new features and enhancements, some of which may have flown under your radar. To help you catch up, here’s a short recap of the latest and greatest from Logz.io with relevant referrals to read up more about the different items.
For a lot of DevOps engineers and SREs, a Grafana dashboard is often the beginning of a troubleshooting procedure. It might be an alert in Slack or a colleague pointing out anomalous system behavior. Or maybe it’s just part of your day-to-day monitoring workflow. Whatever the reason, staring at a beautiful Grafana dashboard is the starting point of what can be either a long and excruciating process, or a short and efficient one.
We’re happy to announce the release of Logz.io Reports — an easy way to set up scheduled reporting for both operational and security use cases. Kibana dashboards provide you with a window into your environment, visualizing the different signals being tracked in a beautiful mix of graphs, charts, and maps. Often used in times of crisis and as the starting point for an investigation, dashboards can also be useful as a static reporting tool for multiple use cases.