Operations | Monitoring | ITSM | DevOps | Cloud

October 2024

Streamline internal communication with status pages

Outages are unexpected events that can suddenly stop an organization's operations. Whether it's a network issue, a key application going down, or a system crash, these problems can cause confusion and disrupt work. Teams scramble to identify the problem, while employees are left in the dark, uncertain about the impact or duration of the issue. A lack of real-time communication can lead to frustrated employees, delayed responses, and prolonged recovery times.

What is OCI monitoring and why is it essential?

Oracle Cloud Infrastructure (OCI) is a powerful, comprehensive cloud platform that supports a wide range of enterprise workloads. Whether you're running complex databases, applications, or large-scale analytics, OCI offers the infrastructure to handle it all. But as with any robust cloud environment, effective monitoring is crucial to ensure performance, security, and cost-efficiency.

Leveraging monitoring to build scalable data pipeline with Amazon Kinesis

In today's data-driven world, businesses need to collect, process, and analyze large volumes of data in real-time to make informed decisions. Amazon Kinesis, a powerful streaming platform, helps companies build scalable and resilient data pipelines. However, ensuring that the pipeline functions efficiently requires robust monitoring practices.

Observability vs. monitoring vs. telemetry: Uncovering the secrets to proactive IT management

In the world of modern IT operations, keeping your systems running smoothly requires measures beyond just basic monitoring. As infrastructures become more complex and dynamic, understanding how telemetry, monitoring, and observability work together is essential. These three concepts may seem similar, but each plays a distinct role in maintaining system health and performance.

Debugging Kubernetes pod pending failures

Every pod has its purpose. During an application deployment, all the workloads in the cluster work cohesively and ensure that the deployment launches—without any hiccups. When a pod is created, it starts its lifetime in a Pending state. A pod is in the Pending state when it is still in the process of being scheduled for deployment. When it is scheduled for deployment and the containers have started, it converts to the Running phase. It only takes a few seconds for the phase transition.

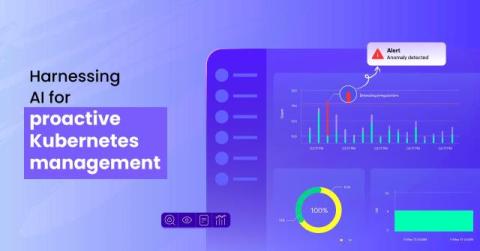
Optimizing Kubernetes workloads with AI-powered monitoring

Kubernetes has drastically simplified application deployment. However, managing workloads in Kubernetes is a challenge because of their innate complexity and dynamism. Frequent bottlenecks and unpredictable application behavior can make managing Kubernetes workloads much harder. This has become simpler and lighter after the expansion of AI, which provides a more intelligent approach to managing and optimizing Kubernetes environments.

The role of AI in Kubernetes monitoring

In a dynamic environment like Kubernetes, where manual tracking is impossible, AI-powered monitoring tools, such as Site24x7, surf through enormous amounts of data, detecting irregularities, predicting vulnerabilities, and alerting the user about a possible outage that is about to happen if the resource is not handled.

Identifying performance bottlenecks in complex applications

Performance bottlenecks can sneak in and slow everything to a crawl regardless of how advanced your application is. These hidden culprits can turn a seamless user experience into a frustrating one. In this blog, we’ll uncover the most common bottlenecks that drag down complex applications and share proven strategies to identify and resolve them. By the end, you'll have the tools to keep your application running at top speed, regardless of the workload.

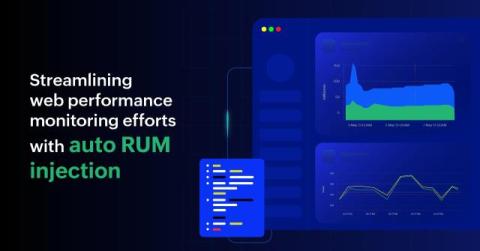
How can you simplify web performance monitoring with auto RUM injection

Real user monitoring (RUM) is a powerful tool for optimizing the end-user experiences of web applications. With insights into performance, load times, user behavior, and more, RUM enables businesses to identify and address issues that negatively impact user satisfaction. Consider a scenario where a growing e-commerce company experiences periodic slowdowns during peak hours, adversely affecting user experiences and sales.

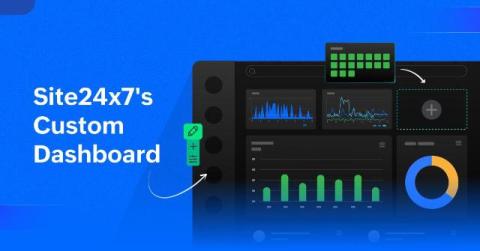
Transform your monitoring experience-Site24x7's Custom Dashboard

The dashboard in Site24x7 provides a solid foundation, but its true potential is unlocked through customization. Custom Dashboards enable you to personalize your monitoring experience, focusing on the metrics that matter most to you. By incorporating a variety of widgets, you can create a tailored and comprehensive view of your system's performance. Site24x7’s Custom Dashboards come packed with features designed to elevate your monitoring capabilities.

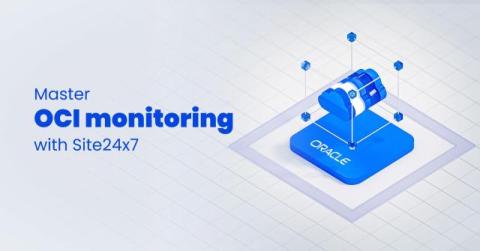
Introducing Site24x7's OCI Monitoring: Optimizing Oracle Cloud Infrastructure

As businesses increasingly rely on cloud services, managing cloud environments efficiently has become more crucial than ever. Oracle Cloud Infrastructure (OCI) is a leading cloud service provider, offering a robust suite of cloud services—spanning computing to networking and storage. But to ensure that your cloud resources are always operating optimally, monitoring is not just recommended, it is essential.

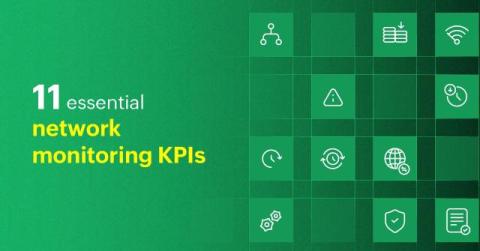
11 helpful KPIs to improve your network performance

Digitalization has surpassed network modernization, resulting in networks struggling to keep up with daily operations. While many networks can accommodate GenAI and other new technologies, network administrators are responsible for maintaining uninterrupted operations and preventing any errors. For this, they must diligently monitor network performance and related metrics so their networks remain secure and robust yet flexible enough to adapt to the latest technologies.