Operations | Monitoring | ITSM | DevOps | Cloud
Circonus
Passport Agent Manager - Installation on Ubuntu Linux
How to Develop a Modern Monitoring & Observability Strategy for Businesses of Any Size
In the dynamic world of IT, the way we monitor systems has seen a remarkable evolution. Gone are the days when monitoring was limited to basic server checks or infrastructure health. With the rise of cloud-native applications, serverless architectures, and container orchestration platforms like Kubernetes, the digital landscape has become a multi-dimensional maze.
4 Ways a Consistent Schema Drives More Value From Your Observability Data
One of the hardest challenges in computer science is deciding what to name things. Adoption of consistent nomenclature is difficult because there is no one right answer. In fact, it’s not uncommon for different teams within organizations to choose different names for the same technologies. In the world of monitoring and observability, this can create quite a lot of confusion – not to mention wasted resources.
Introducing the Telemetry Cloud: An All-In-One Observability Platform All Enterprises Can Afford
We’re excited to announce that we just released the next-generation of our observability platform – the Circonus Telemetry Cloud™. Here’s a closer look at what it is and why we think it’s a standout in the monitoring and observability space.
Domain Driven Design For All
Domain Driven Design (DDD) is usually associated with microservice architectures. As microservice architectures have been perceived as burdensome and overly complex, so too have organizations started to call into question the relevance of DDD initiatives. The argument is usually that unless an organization reaches a mega-scale that requires eventing to keep and micro-services to scale horizontally, such architectures are overkill.
Video: How to Apply the Golden Signals to Your Monitoring Strategy
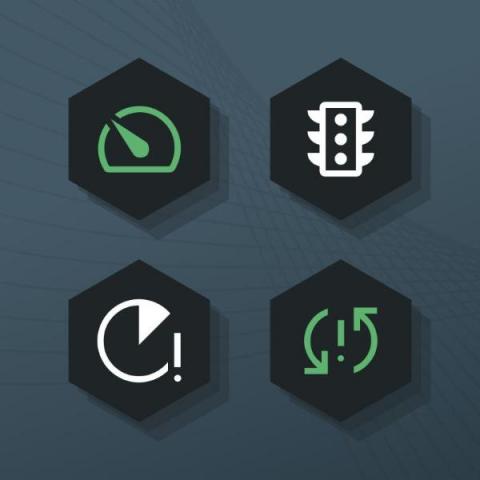
The Four Golden Signals, developed by Google SREs, are key metrics used to monitor the health of your systems. In today’s complex IT environments, these key metrics can help engineers and IT operations prioritize the most significant issues to address. The Four Golden Signals include: In the following 9-minute video, I focus on two of these signals in particular, latency and errors, because they often result in customer-facing symptoms.
Common Causes of Outages and Tips to Prevent Them
Recently, Ron DeSantis used Twitter Spaces to launch his presidential campaign. At least, he tried to. As you may have heard, the event was marred with technical difficulties, resulting in false starts, confused hosts, glitches, echoes, and the “melting” of servers. Of the more than 600,000 Twitter users who initially tuned in, less than half remained by the time they relaunched the event using a different account.
Data Shows Outage Time & Costs are Increasing - 3 Solutions You Should Consider
The Uptime Institute recently released its Annual Outage Analysis 2023 report. Overall, the report highlights the increasing costs, frequency, and duration of outages, the prominent role of cloud and digital services in outages, the shortcomings of service providers, and the need to address human error and management failures. It also underscores the ongoing challenges of handling failures in complex distributed architectures.
Correlating Metrics, Traces, & Logs-Without the Swivel Chair
Correlation in monitoring and observability refers to the process of analyzing different types of data to identify and understand relationships between application, network, and infrastructure behavior. Correlating these data sets can help IT teams identify all technology components contributing to or impacted by a performance or reliability issue, thereby empowering them to identify root cause and troubleshoot faster.


