Operations | Monitoring | ITSM | DevOps | Cloud

Circonus

Have you Hit a Scaling Wall with Prometheus?

While Prometheus has been available since 2012, its popularity has skyrocketed in the last five years as it became the de facto solution for Kubernetes. Although Prometheus may be suitable for smaller environments, it was not designed for ultra high scale use cases or store data long-term. So as organizations are increasingly growing their Kubernetes deployments and generating substantially more data, they are reaching the limits of what they can do with standard Prometheus implementations.

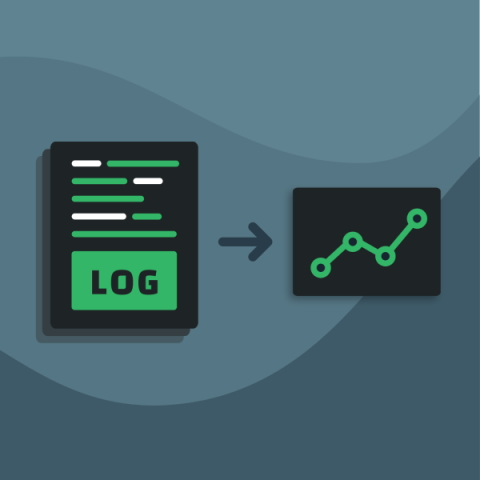
Suffering from high log costs? Too much log noise? Finally, a solution for both.

IT outage times are rapidly increasing as businesses modernize to meet the needs of remote workers, accelerate their digitalization transformations, and adopt new microservices-based architectures and platforms. Research shows that mean time to recovery (MTTR) is ramping up, and it now takes organizations an average of 11.2 hours to find and resolve an outage after it’s reported—an increase of nearly two hours since just 2020.

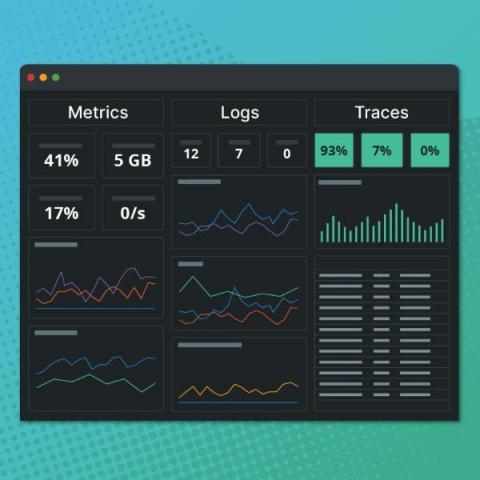
Correlate Metrics, Traces, & Logs in a Single View With Circonus Unified Dashboards

× As organizations shift to service-centric environments, they are generating substantially more data. This in turn has placed strains on monitoring and observability teams, who now must sift through an abundance of data in order to identify and resolve issues — a challenge exacerbated by the number of various monitoring tools they’ve implemented over the years.

Outgrown your ELK self-managed clusters and not sure what to do about it?

As data volume grows, managing your ELK stack can become resource-intensive. Organizations outgrowing ELK are often using multiple different tools, experiencing performance issues, paying too much in log storage, and spending significant time troubleshooting. But while the pain is real, many are hesitant to make a change. The thought of migration yields fears of lost productivity, performance and financial risks, and disappointment in losing some things you love that you worked hard to create.

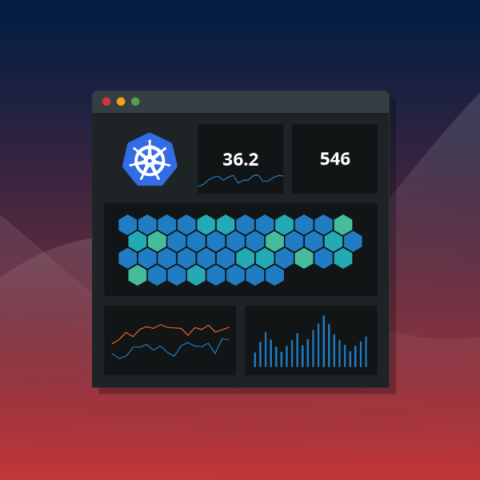
Kubernetes Health-Check: The Most Critical Health Conditions To Monitor

Kubernetes can generate so many types of new metrics (millions every day) that one of the most complex aspects of monitoring your cluster’s health is filtering through these metrics to decide which ones are important to pay attention to. In fact, in a survey that Circonus conducted of Kubernetes operators, uncertainties around which metrics to collect was one of the top challenges to monitoring that operators face.

3 Challenges of Kubernetes Monitoring (With Solutions)

Kubernetes monitoring is complicated. Knowing metrics on cluster health, identifying issues, and figuring out how to remediate problems are common obstacles organizations face, making it difficult to fully realize the benefits and value of their Kubernetes deployment. Understanding how to best approach monitoring Kubernetes health and performance requires first knowing why Kubernetes observability is uniquely challenging.

How Major League Baseball Scales Kubernetes Monitoring

Millions of global baseball fans tuned into the World Series last week, and we at Circonus were proud to help our customer, Major League Baseball, ensure they provided those fans with seamless viewing experiences. To celebrate our partnership, we’re rolling the replay on how MLB overcame Kubernetes observability challenges with Circonus as the league quickly scaled its Kubernetes deployment.

How to Simplify Your Graphite Metric Ingestion Pipeline with Histograms

Many organizations relying on Graphite will be leveraging telemetry provided through Statsd. And if you rely on Graphite in combination with StatsD telemetry, you’re likely suffering from aggregation bloat. In a typical Graphite ingestion pipeline, applications emit data points via UDP, which are then received by an aggregator such as StatsD. Most StatsD servers only offer static aggregations, which must be configured upfront.

The Scaling Limitations of Graphite and Solutions to Overcome Them

Graphite is a free open-source software (FOSS) tool that monitors and graphs numeric time-series data. Graphite was originally a project developed internally at Orbitz in 2006, which eventually grew to be their foundational monitoring tool. In 2008, Orbitz allowed Graphite to be released under the open source Apache 2.0 license. Graphite made it possible to know more than simply if applications were up and running.

Easily Scale Your Graphite Deployment

The Graphite database has engineers feeling stuck. Perhaps you’re one of them. You find yourself collecting metrics that were defined years ago when the system was put in place, likely by someone who is no longer with the company. These pre-aggregations make it necessary to collect more data, which results in increased infrastructure and disk space costs.