Operations | Monitoring | ITSM | DevOps | Cloud

netdata

Monitoring systemd logs with Netdata using the systemd journal Function

The systemd journal plugin by Netdata makes viewing, exploring and analyzing systemd journal logs simple and efficient. It automatically discovers available journal sources, allows advanced filtering, offers interactive visual representations and supports exploring the logs of both individual servers and the logs on infrastructure wide journal centralization servers.

Exploring systemd journal logs with Netdata

Today, we released our systemd journal plugin for Netdata, allowing you to explore, view, search, filter and analyze systemd journal logs. Like most things about Netdata, this is a zero-configuration plugin. You don’t have to do anything apart from installing Netdata on your systems.This is key design direction for Netdata, since we want Netdata to be able to help even if you install it mid-crisis, while you have an incident at hand.

systemd journal logs: A Game-Changer for DevOps and Developers

“Why bother with it? I let it run in the background and focus on more important DevOps work.”— a random DevOps Engineer at Reddit r/devops In an era where technology is evolving at breakneck speeds, it's easy to overlook the tools that are right under our noses. One such underutilized powerhouse is the systemd journal. For many, it's a mere tool to check the status of systemd service units or to tail the most recent events (journalctl -f).

Netdata, Prometheus, Grafana Stack

In this blog, we will walk you through the basics of getting Netdata, Prometheus and Grafana all working together and monitoring your application servers. This article will be using docker on your local workstation. We will be working with docker in an ad-hoc way, launching containers that run /bin/bash and attaching a TTY to them. We use docker here in a purely academic fashion and do not condone running Netdata in a container.

Netdata Processes monitoring and its comparison with other console based tools

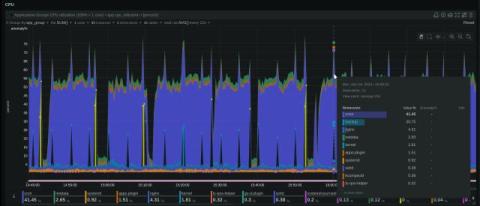
Netdata reads /proc//stat for all processes, once per second and extracts utime and stime (user and system cpu utilization), much like all the console tools do. But it also extracts cutime and cstime that account the user and system time of the exit children of each process. By keeping a map in memory of the whole process tree, it is capable of assigning the right time to every process, taking into account all its exited children.

Netdata QoS Classes monitoring

Netdata monitors tc QoS classes for all interfaces. If you also use FireQOS it will collect interface and class names. There is a shell helper for this (all parsing is done by the plugin in C code - this shell script is just a configuration for the command to run to get tc output). The source of the tc plugin is here. It is somewhat complex, because a state machine was needed to keep track of all the tc classes, including the pseudo classes tc dynamically creates. You can see a live demo here.