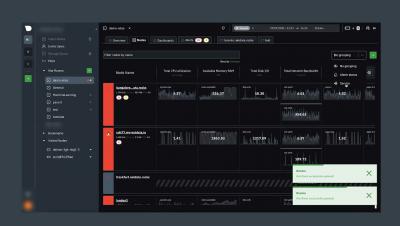
This is the the last of a 2-part blog post series regarding Netdata and Geth. If you missed the first, be sure to check it out here. Geth is short for Go-Ethereum and is the official implementation of the Ethereum Client in Go. Currently it’s one of the most widely used implementations and a core piece of infrastructure for the Ethereum ecosystem. With this proof of concept I wanted to showcase how easy it really is to gather data from any Prometheus endpoint and visualize them in Netdata.
As complexity of systems and applications continue to evolve and change, the number of metrics that need to be monitored grows in parallel. Whether you’re on a DevOps team, an SRE, or a developer building the code yourself, many of these components may be fragmented across your infrastructure, making it increasingly difficult to identify the root cause when experiencing downtime or abnormal behavior.
Current IT monitoring software lacks the necessary metrics for minimizing downtime for systems and applications. Most provide system and application metrics but there is much more than this required for properly monitoring your infrastructure. With eBPF there is a technological advancement that allows monitoring software to provide rich information from the Linux kernel and present it.
It’s been a long time since our last community update, rest assured that we have been hard at work here at Netdata. Community building is hard, especially when you have such a venerable community like the one here at Netdata, where hundreds of contributors have contributed to creating one of the best monitoring solutions that exist. Last year we started to concentrate working on consolidating the community by integrating the various platforms where people come together to talk about Netdata.
Infrastructure monitoring was difficult enough when entire businesses ran off a few bare metal servers in a dusty, forgotten closet. Other IT infrastructure monitoring tools fell short, unable to provide complete and granular-enough metrics in real time, even when we were only dealing with a handful of systems responsible for running every part of the application stack.
We’re excited to introduce Netdata 1.30.0. The ACLK-NG is a new, faster method of securely connecting a node running Netdata to Netdata Cloud. In our internal testing, it’s 4x faster than our previous implementation, which uses libmosquitto and libwebsockets.
Monitoring the current state and performance of applications is critical for IT Ops and DevOps teams alike. Understanding the health of an application is one of the most effective ways of anticipating potential bottlenecks or slowdowns, yet it’s one of the largest challenges faced by many organizations that build and deploy software. This is largely due to applications’ distributed and diversified nature.