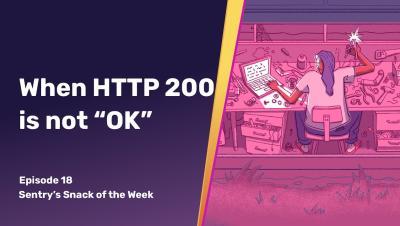
When HTTP 200 is not "OK" | Snack of the Week
Have you ever received an unexpected status code from an API? Read more in our blog: bit.ly/http-status-codes-arent-ok-8.


Bundle Size matters - this is something we SDK engineers at Sentry are acutely aware of. In an ideal world, you’d get all the functionality you want with no additional bundle size - oh, wouldn’t that be nice? Sadly, in reality any feature we add to the JavaScript SDK results in additional bundle size for the SDK - there is always a trade off to be made. With Session Replay, this is especially challenging.
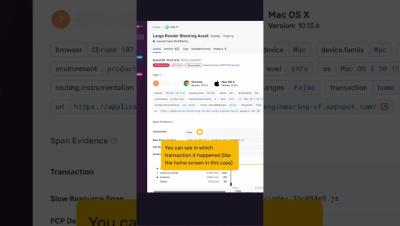
Have you seen this problem? Or maybe this one? You’ve most likely seen this: Hint: they’re all the same. The first image is Sentry’s Event Details page, the second is Chrome’s Network tab, and the code snippet is what causes it. If you can answer yes to any of these, then you need to keep reading. If not, you still need to keep reading, so your future self can thank you. This is called “fetch waterfall” and it’s a common data fetching issue in React.
Your images are 404ing all over the place. You’ve got an angry email from a client. Their site is “broken”, images aren’t loading, cumulative layout shift is running riot, and everything is messed up. The crowds are mocking your broken code on Twitter. A fun GIF loaded via a Giphy URL no longer exists. And someone has accidentally deleted an image from the CMS.
Grab your favorite mug, fill it with some warm chocolatey goodness – it is hot cocoa season after all –, and check out our most recent product updates to Sentry.
A long time ago I worked on a project called Django Debug Toolbar (DJDT). It was a local development plugin that would give you a debug overlay within Django’s development environment, helping you diagnose things like the SQL queries being made, environment configuration, and what templates were rendered. In general, it made the local dev experience much better, helping you prevent or more easily fix things like N+1 queries.