Operations | Monitoring | ITSM | DevOps | Cloud

MetricFire

Graphios - Connecting Graphite and Nagios

Graphios simplifies the process of sending Nagios performance data to backend systems like Graphite. With Graphios, users can easily integrate Nagios with Graphite, eliminating the need for complex scripts. This article explores Graphios' functionality, configuration, and installation process, empowering users to efficiently transfer Nagios data for monitoring and analysis.

Graphite Metrics Delay: Why it Happens and What to Do

To understand why Graphite metrics delay occurs, we must first know what Graphite is. Graphite is an open-source tool used to track the performance of websites, applications, and network servers. It makes it simple to monitor, store, retrieve, and visualize numeric time-series data. While Graphite does make it easier to render graphs on-demand, the struggle of dealing with large amounts of data with minimum delay is real.

Monitoring Android Data with MetricFire

Understanding the performance of Android applications, user interactions, and problem-solving is significantly reliant on data monitoring. As the realm of mobile technology continues to expand, developers are tasked with managing an increasingly large amount of data. When this data is correctly harvested and scrutinized, it can yield valuable insights that inform strategic choices and lead to improvements in the app.

Get Deep Insights Into Your Heroku Applications with Our Comprehensive Cheatsheet

Are you looking to streamline your development process, boost productivity, and deploy your applications effortlessly? Look no further! We are thrilled to announce the release of our Heroku monitoring cheatsheet, designed to be your go-to resource for monitoring Heroku applications.

Monitoring High Cardinality Metrics

Monitoring is all about data. When you implement a monitoring tool, you have to make sure that the monitoring software can handle data. Today, data flows at high speeds and in large volumes. Data also comes in diverse forms, which increases the complexity of data ingestion. Because of this, monitoring solution providers promote, among others, their data processing capacities. If a monitoring platform can handle large and diverse data that comes in at a high velocity, it becomes a big advantage.

Monitoring with Graphite: Architecture and Concepts

In this article, we provide a concise guide to help you get started with Graphite quickly and efficiently. We cover the basic concepts, architectural considerations, and metrics aggregation of Graphite. We also explain the data feeding methods, metrics format, and storage using Graphite's file-based database. Additionally, we discuss visualization options, including Graphite-Web and Grafana.

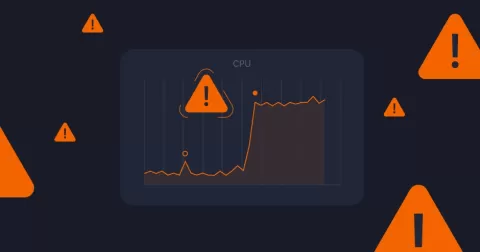
Anomaly Detection With Graphite

Graphite is used by many organizations to track and visualize various metrics that their applications or servers send out. But what happens if there are too many of these metrics or the company doesn't want to use its human resources to monitor the behaviour of metrics constantly? In this article, we will use Hosted Graphite by MetricFire to learn about Graphite's ability to notify users about the abnormal behaviour of services or infrastructure in a timely manner.

The Carbon Daemons: Graphite monitoring

Graphite is a powerful open-source time series database used for storing, retrieving, and visualizing changing numeric data points over time. With its robust monitoring system, Graphite can efficiently handle large data loads without compromising performance. In this article, we delve into the basics of Graphite, focusing on its primary component, Carbon.