Operations | Monitoring | ITSM | DevOps | Cloud

Troubleshoot GKE apps faster with monitoring data in Cloud Logging

When you’re troubleshooting an application on Google Kubernetes Engine (GKE), the more context that you have on the issue, the faster you can resolve it. For example, did the pod exceed it’s memory allocation? Was there a permissions error reserving the storage volume? Did a rogue regex in the app pin the CPU? All of these questions require developers and operators to build a lot of troubleshooting context.

Use log buckets for data governance, now supported in 23 regions

Logs are an essential part of troubleshooting applications and services. However, ensuring your developers, DevOps, ITOps, and SRE teams have access to the logs they need, while accounting for operational tasks such as scaling up, access control, updates, and keeping your data compliant, can be challenging. To help you offload these operational tasks associated with running your own logging stack, we offer Cloud Logging.

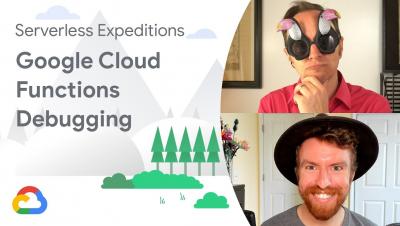
Debugging Cloud Functions

Developing a Cloud Function, but having issues troubleshooting it? In this episode of Serverless Expeditions Extended, we show you how to debug your function locally so you can avoid the risk of testing in production. Watch to learn how you can easily install the Functions Framework, set up the Node debugger, and fix your functions!

New histogram features in Cloud Logging to troubleshoot faster

Visualizing trends in your logs is critical when troubleshooting an issue with your application. Using the histogram in Logs Explorer, you can quickly visualize log volumes over time to help spot anomalies, detect when errors started and see a breakdown of log volumes. But static visualizations are not as helpful as having more options for customization during your investigations.

The Ops Agent is now GA and it leverages OpenTelemetry

Running and troubleshooting production services requires deep visibility into your applications and infrastructure. While basic logs and metrics are available out of the box with Google Cloud Compute Engine (GCE), capturing advanced data used to require the installation of both a metrics agent and a logging agent.

Create alerts from your logs, available now in Preview

Being alerted to an issue with your application before your customers experience undue interruption is a goal of every development and operations team. While methods for identifying problems exist in many forms, including uptime checks and application tracing, alerts on logs is a prominent method for issue detection. Previously, Cloud Logging only supported alerts on error logs and log-based metrics, but that was not robust enough for most application teams.

Dashboards on Cloud Monitoring made easier with samples

Setting up Cloud Monitoring dashboards for your team can be time consuming because every team's needs are different. Picking the right metrics, using the right visualizations to represent these metrics, deciding what metrics can go on the same chart, and determining the right pre-processing steps for metrics requires background and experience that may not yet exist among your development and operations teams.