Operations | Monitoring | ITSM | DevOps | Cloud
Understanding Serverless Observability
Ideally, observability should help you understand the state of your application and how it performs under different circumstances. However, while serverless observability may seem similar to serverless monitoring and testing, the three achieve different goals. Testing helps you check your application for known issues, and monitoring helps you evaluate system health according to known metrics. Observability helps you search and discover unknown issues, providing end-to-end visibility.
Why your next serverless project should use AWS AppSync
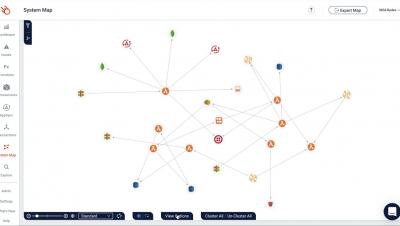
See Lumigo In Action (Demo)
Lambda Extensions Just Got Even Better
AWS announced AWS Lambda Extensions back in October 2020 and I wrote extensively about it at the time – what it is, how it works, and why you should care. In short, Lambda Extensions allow operational tools to integrate with your Lambda functions and run either in-process alongside your code or in a separate process. To better understand the problems they solve and their use cases, please read my previous article.
Webinar: Boost up your serverless applications with Amazon EventBridge
3 Major Ways To Improve AWS Lambda Performance
This piece was originally three different blogs but is now one. In this piece, we lay out three ways you can improve your AWS Lambda performance. So much has been written about Lambda cold starts. It’s easily one of the most talked-about and yet, misunderstood topics when it comes to Lambda. Depending on who you talk to, you will likely get different advice on how best to reduce cold starts.
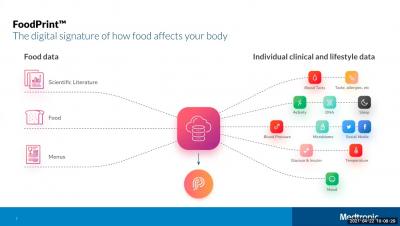
Webinar: How Medtronic Tripled Serverless Development Velocity
Introducing Stackoscope For Serverless Applications
Here at Lumigo, we are focused on helping customers succeed with serverless and make it easier for them to build and run serverless applications in production. We love serverless and operate one of the largest serverless systems out there as we ingest and process billions of events from our customers. One thing many customers have asked us for help with is to identify misconfigured resources or places where they can improve by following best practices.
Feature Spotlight: Dynamic Dashboard
We recently released the Lumigo Dynamic Dashboard to help our customers visualize metrics to monitor their environment the way they want.


