
Top infrastructure monitoring mistakes (and how to avoid them)
")
Image Source: depositphotos.com
Infrastructure monitoring is meant to simplify operations, not overwhelm teams with noise. Yet the average IT team receives more than 10,000 alerts every day. Despite this constant stream of notifications, critical issues still slip through the cracks.
This volume of fragmented data creates a dangerous visibility gap across the infrastructure. As a result, teams can spend more time sorting through alerts than actually resolving issues.
Often, the challenge lies in how monitoring is implemented. Understanding these pitfalls can help organizations avoid common mistakes and improve their monitoring strategy to maintain a more reliable infrastructure.
Four common infrastructure monitoring mistakes
Infrastructure monitoring failures are rarely from a single dramatic error. More often, they result from subtle oversights that accumulate over time, until they surface as a costly outage or a missed SLA. Here are four of the most common mistakes.
1. Configuring alerts with static thresholds
When monitoring systems are configured with rigid, static thresholds, teams are often flooded with alerts that don't reflect actual issues. Over time, this volume desensitizes engineers to incoming notifications, and when a genuine incident occurs, it risks being overlooked. This results in many irrelevant alerts rather than significant and urgent ones.
2. Fragmented visibility and tool sprawl
Many organizations monitor servers, applications, and networks using separate, disconnected tools.It is not uncommon for IT teams to juggle five to eight monitoring dashboards every day, switching between tools to understand what is happening across servers, applications, networks, and cloud environments. While each tool may perform well in isolation, the lack of a unified view creates significant gaps during incident response.
3. Monitoring availability instead of performance
Traditional monitoring often focuses only on uptime, checking whether a server or service is running. However, systems can remain up while experiencing serious performance issues such as high latency, resource exhaustion, or network congestion. The consequences of these issues go far beyond technical metrics: even small delays can quickly frustrate users and impact business outcomes.
For example, every 100 ms increase in latency can lead to a measurable drop in customer satisfaction and conversion rates.
4. Reliance on manual remediation
Treating monitoring as a purely observational task creates a massive bottleneck. If the response to a predictable failure requires a human operator to log in and manually execute a fix, such as a crashed service or a full temporary directory, , the operational model is inefficient. Automation and intelligent remediation workflows are necessary to handle the scale and complexity of modern infrastructure.
How does Site24x7 overcome these challenges?
Site24x7 is designed to address each of these monitoring gaps directly, as part of a single, unified observability platform.
1. Cutting through alert noise with smart thresholds
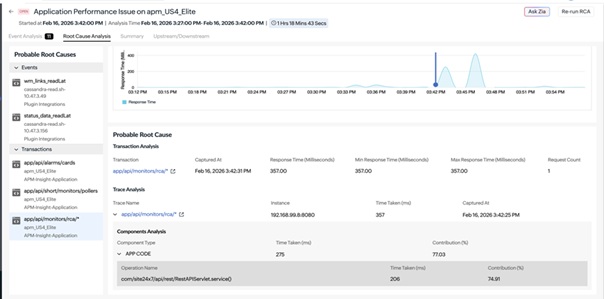
To reduce alert noise from static thresholds, Site24x7's AIOps uses Zia, an AI engine that sets dynamic performance baselines.
- Anomaly Detection: Instead of triggering alerts on fixed numbers, the platform learns historical patterns, accounting for seasonality and time-of-day fluctuations. Alerts are only dispatched when a metric deviates significantly from its unique normal behavior.
- Event Correlation: Site24x7 automatically groups related events, such as a latency surge and a corresponding CPU spike, into a root cause analysis report. This prevents the typical alert storm and provides immediate context for troubleshooting.
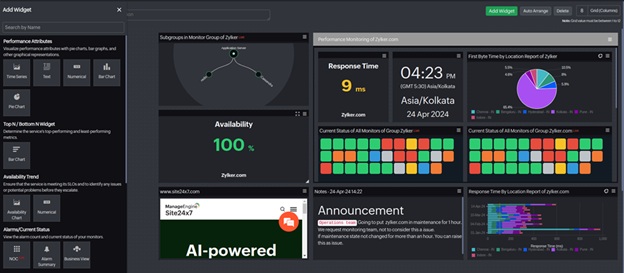
2. Solving tool sprawl with unified observability
Site24x7 eliminates tool sprawl by bringing servers, cloud services, networks, and logs into a single monitoring platform. Rather than manually correlating data across disconnected tools, teams get a unified view linked automatically.
When an incident occurs, Site24x7's event correlation engine connects related signals across layers identifying. For example, a spike in application errors traces back to a network bottleneck, a resource-exhausted server, or a misconfigured cloud service without a single tool switch.
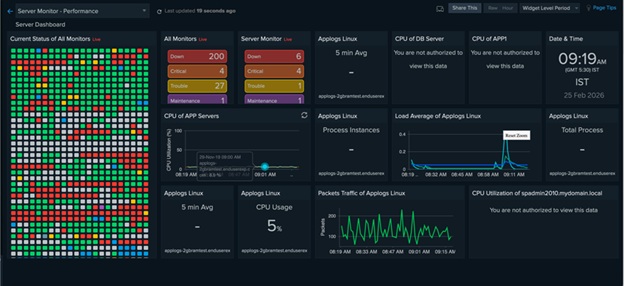
3. Transitioning from availability to performance monitoring
To move beyond basic up/down checks, Site24x7 provides detailed performance metrics that reveal early signs of infrastructural issues. This visibility allows teams to monitor vital signs such as network packet loss, cloud resource throttling, and storage I/O latency to catch degradation before it leads to an outage.
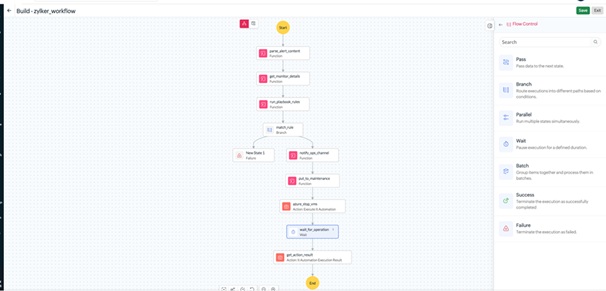
4. Eliminating manual bottlenecks with IT Automation
Treating monitoring as a purely observational task creates operational bottlenecks. When predictable failures such as a crashed service or full disk require manual fixes, incident response slows down. Site24x7 addresses this with IT automation and remediation workflows that trigger predefined actions when alerts occur, reducing MTTR and minimizing manual intervention.
Conclusion
Effective infrastructure monitoring is not defined by the number of tools in use or the volume of alerts generated. It is defined by how quickly and accurately teams can detect, diagnose, and resolve issues before they impact operations.
However, the mistakes outlined in this post can be addressed. With the right configuration, unified visibility, and automated workflows in place, monitoring becomes a reliable foundation for operational stability instead of an additional source of overhead.
Site24x7's infrastructure monitoring provides the visibility, intelligence, and automation teams need to monitor smarter, respond faster, and keep modern infrastructure running consistently.