
The Critical Role of CPU Monitoring for Modern Network Admins

For network administrators, maintaining seamless and uninterrupted system performance is an ongoing, vital responsibility. In environments ranging from hundreds of endpoints to complex hybrid clouds, CPU monitoring stands out as a critical tool. Without it, proactively identifying and resolving performance slowdowns, service lags, or outages is impossible, leaving you to reactively guess at solutions.
Discover why CPU monitoring is a must-have for network admins. This guide will show you what to monitor and how it directly impacts your network's uptime, user experience, and overall operational efficiency.
What Does CPU Monitoring Mean for Networks?
Essentially, CPU monitoring offers the ability to gain deep, actionable insights of your systems' processing power. Beyond just collecting data, it involves tracking critical indicators such as CPU usage levels, temperature changes, and workload trends. This process turns raw information into concrete answers, helping you pinpoint the exact causes, timing, and reasons behind performance bottlenecks.
This allows network admins to answer questions like:
- What was the root cause of the file server's performance dip yesterday afternoon?
- Is the backup process causing resource overload during non-business hours?
- Should we upgrade hardware or reallocate workloads?
The Importance of CPU Monitoring for Network Admins
- Ensuring continuous system uptime, even under intense CPU utilization
Excessive CPU load on vital servers risks performance degradation or, more critically, service outages. With CPU monitoring, you gain early alerts for abnormal usage patterns, allowing intervention before system failures or application freezes occur.
- Using CPU and network data together to uncover root causes
CPU metrics alone offer an incomplete picture. Yet, when you correlate elevated CPU usage with network traffic, application logs, and I/O statistics, you unlock the ability to precisely identify the true origin of performance problems. From rogue scripts to misconfigured services or flawed updates, CPU monitoring delivers the diagnostic insights needed for swift fixes.
- To optimize capacity planning
Consistent CPU usage trend analysis clearly shows if your infrastructure is over or under-provisioned. It answers if domain controllers are overloaded during peak hours or if virtual machines lack CPU cycles. This historical data is key for justifying hardware upgrades or proving current optimization is effective.
When parallel Backups Overwhelmed CPU: A Service Failure Case
Imagine you're a network administrator for a mid-sized enterprise, overseeing both physical servers and virtual machines. One evening, you're hit with a barrage of complaints: painfully slow remote access, lagging VPN services, and internal users unable to reach shared drives.
Upon checking the CPU dashboard, you discover that between 2 AM and 3 AM, several servers were operating at nearly 100% CPU utilization. A deeper investigation reveals that the backup software had simultaneously initiated full system image jobs across multiple machines.
Without CPU monitoring, this pattern would have gone unnoticed. However, with live data and alerts, you can now:
- Instantly detect the overload trend.
- Adjust backup schedules to evenly distribute the CPU load.
- Configure stricter CPU threshold alerts for these servers, particularly during their maintenance windows.
- Address recurring contention by proactively assessing and reallocating virtual machine resources.
This leads to a significant improvement: no more late-night service disruptions, and a more content team with complete trust in system performance during critical times.
Essential CPU Metrics for Network Admins
To effectively monitor CPU, network admins should prioritize metrics that offer clear, actionable insights into system performance and health rather than getting bogged down by every obscure counter.
Key metrics typically include:
- CPU Utilization (Overall and Per-Core): This metric shows the percentage of time the CPU is active. Consistently high utilization clearly signals a problem or a need for more capacity, while per-core statistics help pinpoint imbalances.
- CPU Load Average (Linux/UNIX): This shows how many processes are waiting for CPU. If the load average consistently exceeds the number of cores, it indicates a bottleneck.
- Idle Time vs. User Time vs. System Time: Grasping how CPU cycles are allocated across these categories is crucial for effective monitoring.
- User Time: Indicates CPU activity on user applications.
- System Time: Reflects CPU time spent on operating system tasks (kernel operations).
- Idle Time: When the CPU is not busy. Consistently low idle time signals an issue.
- Context Switches and Interrupts: Elevated rates of these can point to inefficient applications or driver problems, which consume CPU cycles unproductively.
- CPU Temperature Readings (for physical servers/devices): Monitoring these is crucial, as overheating can lead to performance throttling or irreversible hardware damage.
- Top Processes by CPU Load: This metric is essential for quickly identifying which specific services or applications are consuming the most resources.
- Historical Trends and Baselines: Identifying deviations from normal behavior is crucial. This allows you to determine if a CPU spike is a typical occurrence, like during month-end processing, or if it's an unexpected anomaly.
When selecting CPU monitoring solutions, ensure they integrate seamlessly with your existing environment, supporting protocols like SNMP, WMI, and SSH, as well as cloud APIs. For network admins managing diverse infrastructures, including switches, firewalls, Windows/Linux servers, and virtual platforms and agent-based or hybrid options provide the necessary flexibility for complete coverage.
What Makes OpManager a Top Choice for CPU Monitoring?
When overseeing a large number of devices, having a unified view of all CPU metrics can boost efficiency. ManageEngine OpManager is built with network admins in mind, offering:
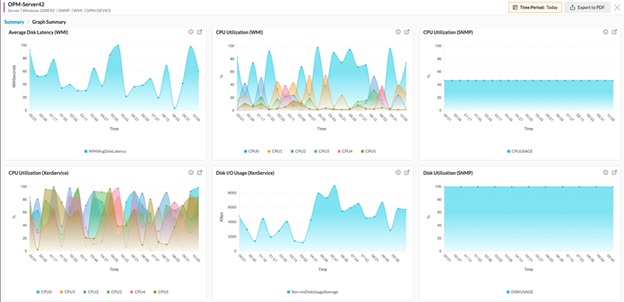
- Comprehensive Real-time Dashboards: OpManager provides intuitive dashboards that offer live CPU usage, per-core performance, and temperature readings through clear gauges and heatmaps. This gives you an instant, consolidated view of which servers or network devices are under stress, without juggling different consoles.
- CPU Hardware monitoring: To ensure optimal CPU performance, it's vital to monitor its core hardware components. This includes constantly tracking CPU temperature, fan speed, and voltage levels. OpManager helps you do exactly that: it lets you keep tabs on all these crucial hardware properties, so you can quickly identify and troubleshoot hardware faults. Plus, you can generate hardware health reports to analyze past trends, helping you make smarter decisions about your CPU's well-being.
- Custom Thresholds and Automated, Multi-Channel Alerts: OpManager lets you configure precise CPU thresholds for different devices. Should a file server's CPU exceed 90% or a VM's CPU remain at 80% for too long, you'll receive immediate alerts through email or SMS. This ensures you can tackle problems proactively, rather than reactively.

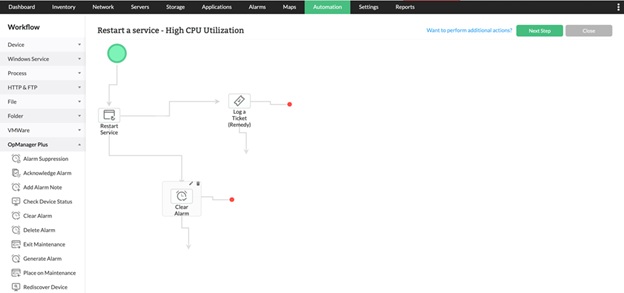
- Intelligent Automation with Workflows: With OpManager, you can set up automated actions, such as executing a cleanup script if CPU idle time drops, or restarting a stuck service when CPU usage is consistently high. This automation minimizes manual intervention and accelerates problem resolution.
- Scalable Architecture for Mixed Environments: Designed to adapt to your growing infrastructure, OpManager effectively monitors physical servers, virtual machines (VMware, Hyper-V), and cloud instances (AWS, Azure). Thanks to its powerful auto-discovery, new devices are quickly integrated, and their CPU metrics are often visible in your dashboard, saving you significant manual effort.
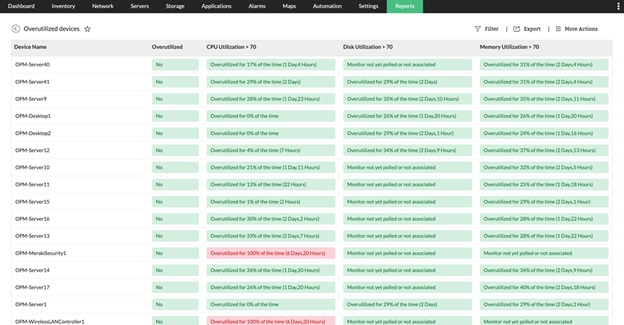
- In-depth Reporting and Trend Analysis for Capacity Planning: Access comprehensive, customizable reports built from historical CPU data. Analyze trends over time to pinpoint recurring problems, identify peak load periods, and make smarter capacity planning choices. With concrete, visual data, discussing budget requirements with leadership is much simpler. Plus, these reports can be scheduled for automatic delivery straight to your team.
- Seamless Integrations and Multi-Vendor Support: OpManager easily integrates with a wide range of network devices and servers using SNMP, WMI, CLI, and API. Its pre-built templates ensure effortless CPU data collection from virtualization platforms, cloud services, and edge appliances.

With these robust capabilities, OpManager enables a proactive approach to network management. You can quickly identify CPU anomalies, automate routine solutions, and ultimately keep your entire infrastructure performing at its best.
Prioritize CPU monitoring: It's time for a proactive approach
CPU monitoring is more than just visuals; it's about staying proactive, resolving issues before they impact users, making data-driven decisions, and ensuring your infrastructure remains resilient and reliable.
If you're not yet monitoring CPU data, start now. Even short-term monitoring can expose hidden bottlenecks or inefficiencies. Such insights are invaluable for proactive planning, building a compelling argument for necessary budget increases, and maintaining a consistently smooth experience for all network users.
Want to see how ManageEngine OpManager can improve your CPU monitoring? Grab our 30-day free trial to experience advanced CPU insights and full network monitoring, risk-free.
Author Bio:
Sandhya Saravanan is a Product Marketer at ManageEngine. She creates user-friendly content that drives awareness around advanced network monitoring, observability, and AIOps. Beyond work, she's an art enthusiast and volunteers at a non-governmental organization.