Operations | Monitoring | ITSM | DevOps | Cloud

Introduction to Ingesting OpenTelemetry Logs with Loki | Zero to Hero: Loki | Grafana

Have you just discovered Grafana Loki and are planning to use OpenTelemetry as your instrumentation tool of choice? Or looking for an introduction to what OpenTelemetry is? In this Zero to Hero episode, we cover the basics of instrumenting your code with the Otel SDK, the Otel Collector and the new native Otel endpoint of Loki.

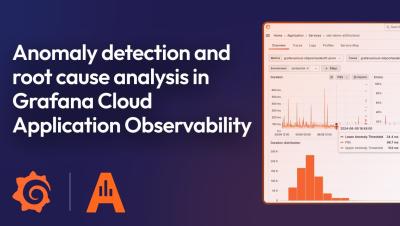
Anomaly detection and root cause analysis with Application Observability | Grafana Cloud

In this video, we walk you through the latest features of Grafana Cloud Application Observability, designed to accelerate anomaly detection and root cause analysis. Application Observability offers an out-of-the-box solution for monitoring applications and minimizing MTTR. It natively supports both OpenTelemetry and Prometheus and allows you to seamlessly unify application and infrastructure insights.

How to Scale and Standardize Observability Practices: Hear from Canva and Atlassian | Grafana

This panel discussion, featuring Jenna, Director of Engineering, Reliability Platforms at Canva and Andrew, Head of Engineering at Atlassian, explored the challenges and strategies of implementing standardization in large tech companies. Atlassian, known for its software development and collaboration tools, initially faced resistance to standardization but shifted as inefficiencies and compliance issues emerged. Canva, a graphic design platform, highlighted the balance between flexibility and standardization, using observability tools for accountability.