Operations | Monitoring | ITSM | DevOps | Cloud

Detecting and Investigating Threats in Splunk Security Analytics for AWS

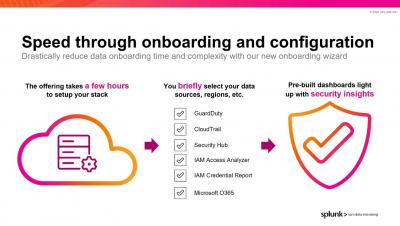
Splunk Security Analytics for AWS’s pre-built, AWS-specific detections and dashboards allow you to easily visualize your AWS environment and centralize your security analysis and investigations. We’ll walk through some of the offering’s key dashboards and detections in this video, as well as the investigation interface.

SOCtails Episode 4 - Respond Fast to Security Incidents with Automated Playbooks

Investigating and responding to phishing attacks is tedious and time-consuming. Kevin responds to phishing attacks by following a step-by-step manual process catalogued in his "Cybersecurity Playbook." Jeff shows Kevin an easier and faster way to respond using automated playbooks from Splunk SOAR (formerly known as Splunk Phantom).

How Can Companies Benefit from Observability? | Splunk's Spiros Xanthos & influencer Jo Peterson

Observability – what is it? Until now, the tools IT and DevOps teams have relied on to monitor and manage applications have often been disconnected. With a massive shift to cloud infrastructure, organizations are now wrestling with operational complexity. Leadership must look to solutions that break down silos and offer real-time insights and visibility to decrease time troubleshooting.

Rappi Relies on Splunk Observability Cloud to Meet its 30-Minute Guarantee

Hear from Rappi’s EVP Engineering, Alejandro Comisario about how as one of the largest technology startups in Latin America, the on-demand delivery service relies on the Splunk Observability Cloud for real-time, end-to-end visibility across its complex backend system of 1k+ microservices. Since COVID-19 Rappi has grown 300%, relying on Splunk’s real-time observability to eliminate app issues for customers and stay on top of its infrastructure, applications, and overall business. With Splunk APM, Rappi now has in-depth insights into service behavior and directed troubleshooting, bringing developers’ mean-time-to-resolution (MTTR) down by 90+%.

Splunk Log Observer: Log analysis built for DevOps

Log analysis is a key part of getting answers from your stack, and Splunk Log Observer, part of the Splunk Observability Cloud, is built for fast, powerful log analysis. Trust the industry-leading expert on logs to help you draw insights fast from any volume of data, in real-time, without having to write any queries by hand.

Splunk Digital Experience Monitoring: Real insights into real user experience

Great user experience and web performance are essential for modern applications. Time spent waiting leads customers to leave. To keep users happy and revenue flowing, you need to know what's happening from the user's perspective. Splunk Digital Experience Monitoring (RUM & Synthetics) helps you see how your users really experience your site. As part of Splunk Observability Cloud, Digital Experience Monitoring gives you an end-to-end look at how your application is performing.