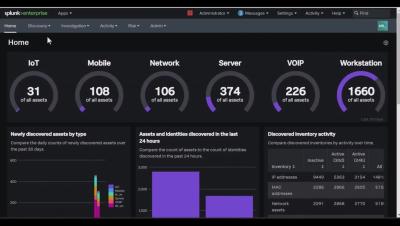
Operations | Monitoring | ITSM | DevOps | Cloud

Troubleshooting Microservices with Splunk Observability Cloud and the AI Assistant for Observability

In this video, I’m going show you how to troubleshoot microservices in Splunk Observability Cloud using features like APM’s Service Map and Tag Spotlight to identify what’s causing our microservice to produce high error rates. We’ll then review Related Logs in Log Observer to determine why the error in our service is occurring.

Infrastructure and Observability as Code | An Introduction

In this video I will introduce you to the concept of Observability as Code and what that looks like in Splunk Observability Cloud. I’ll first discuss the issues you might encounter managing infrastructure manually, and then define Infrastructure as Code so that you have a better understanding of the motivation behind Observability as Code. We’ll briefly introduce Terraform and then I’ll discuss the benefits of implementing Observability as Code using Splunk’s Terraform provider in Splunk Observability Cloud.

Introduction to The Splunk Terraform Provider | Create a Detector in Splunk Observability Cloud

In this video I will demonstrate how to use the Splunk Terraform Provider. I’ll explain what it is and why you should use the Splunk Terraform Provider as part of your overall Observability as Code solution. Using a simple Terraform project, I will walk you through the setup of the provider and the creation of a Detector in Splunk Observability Cloud.

Automatic Discovery and Instrumentation of PostgreSQL with Splunk OpenTelemetry Collector

In this video I’ll walk through the steps to instrument a PostgreSQL database using the Automatic discovery and configuration feature of the Splunk OpenTelemetry Collector. We’ll use an install script to install and run the Collector with discovery mode on a Linux machine where the database is running. I’ll then show you how to properly configure the PostgreSQL receiver properties so that the Collector is able to connect and authenticate to the database. Once the Collector is successfully configured, I’ll show you how to view those metrics in Splunk Observability Cloud.