Operations | Monitoring | ITSM | DevOps | Cloud

The Place Where Modern Operations & Technology Come Together

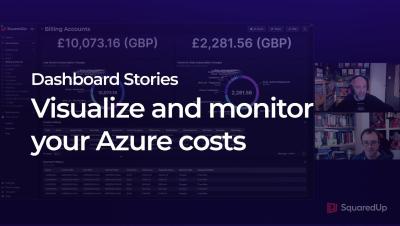
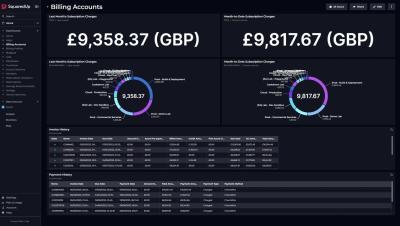
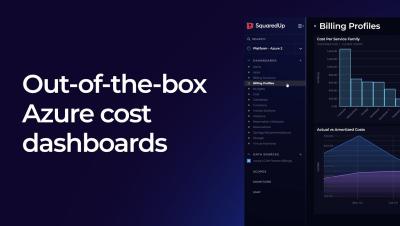
Monitoring Azure cost with SquaredUp
See just how simple it is to connect Azure to your SquaredUp workspace, and see you live cost data immediately loaded up in tons of out-of-the-box dashboards. Get instant visibility of your subscription spend, budgets, forecasted spend, amortized cost, reserved instances and more.
Visualize PowerShell scripts in SquaredUp
A brief introduction to SquaredUp's PowerShell plugin. Learn how easy it is to run PowerShell scripts in SquaredUp, and visualize any data returned.