Sneak Preview of New Visualizations Coming to Grafana
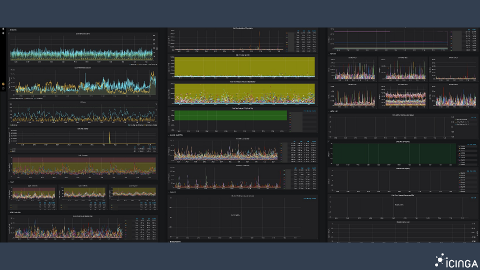
We have been working on a new panel and component architecture for the last half year (or more), and it’s finally starting to bear fruit in terms of new visualizations and capabilities.
I recently gave a talk at DigitalOcean Tide in Bangalore on “Grafana and the DigitalOcean Marketplace.” The DO Marketplace lets you launch a range of open source software, including Grafana, with just a few clicks. This post is not about the marketplace – I’m going to talk about how we automated the building of the images.
One of the major projects we’re working on for Metrictank – our large scale Graphite solution – is the meta tags feature, which we started last year and are targeting to release in a few months. A lot of people don’t realize this, but Graphite has had tag support for more than a year. Our mission with Metrictank is to provide a more scalable version of Graphite, so introducing meta tags was a logical next step.
In the beginning, the mission of the logging and monitoring team at eBay was simple: “to give out APIs that the developers in the company could use to instrument their applications [in order] to send logs,” Vijay Samuel said during his talk at GrafanaCon about eBay’s journey to using Grafana plugins. “We had our own developers who built out UIs for being able to search view and debug their issues. And metrics were no different from logs.
The engineers at Grafana Labs have their heads in the clouds. “This is a new world: We have hybrid clouds and multiclouds,” Daniel Lee told the crowd gathered at GrafanaCon 2019 in Los Angeles. And the advantage clients have when using Grafana’s hosted services is that “they can deploy them on any cloud,” said Lee.
A few weeks have passed since the excitement of the major Grafana 6.0 release during GrafanaCon, which means it’s time for a new Grafana release. Grafana 6.1 iterates on the permissions system to allow for teams to be more self-organizing. It also includes a feature for Prometheus that enables a more exploratory workflow for dashboards.
The grafana-polystat-panel plugin was created to provide a way to roll up multiple metrics and implement flexible drilldowns to other dashboards. This example will focus on creating a panel for Cassandra using real data from Prometheus collected from our Kubernetes clusters. We’ll focus on the basic metrics for CPU/Memory/Disk coming from cAdvisor, but a well-instrumented service will have many metrics that indicate overall health, such as requests per second, error rates, and more.
In the Prometheus 2.7 release, Ganesh Vernekar added a feature called “Subqueries”. Ganesh published an explanation of how to use subqueries over on the Prometheus blog. In this post we’ll share a couple of real-life examples of how we use them at Grafana Labs.
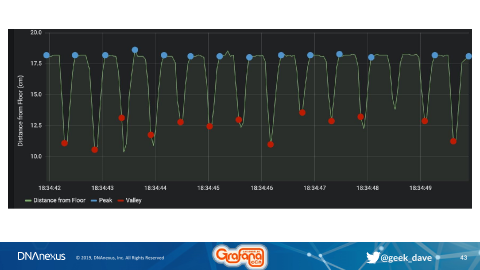
This week we have updates and articles from the Grafana Labs team, some initial impressions on our Prometheus-inspired log aggregation project Loki, and lots more. Plus learn how to make your own air quality monitor.
Where we left off: AWS had taken the Elasticsearch software and launched their own cloud offering in 2015, and Elastic N.V. had doubled down on an “open core strategy.” Once AWS decides to offer a project like Elasticsearch, it immediately becomes a truly formidable competitor to anyone trying to do the same, even the company behind the software itself. AWS has huge scale, operational expertise, and various network effects that really compound.