Operations | Monitoring | ITSM | DevOps | Cloud
Latest Posts
How to Monitor HTML Canvas for Load and Uptime
Before diving into how to monitor HTML Canvas, let’s define it. HTML Canvas is a powerful feature of HTML5 that allows developers to create and manipulate graphics, animations, and other visual effects using JavaScript. It’s a blank slate on which you can draw whatever you want, making it an excellent tool for creating interactive and dynamic web content.
How to Monitor Website Uptime in 2023
An essential element of your business success lies in establishing trust between you and your users. A big part of this is a reliable website that performs and is there when your users need it. We’ll show you how a website uptime monitoring tool can help you achieve excellence online, with all the wide-ranging benefits that encompasses, not least engendering trust between you and your users.
Why Uptime Monitoring Is Essential for Your Business
Website downtime is a serious concern for businesses as it directly impacts the bottom line and can cause significant downstream effects as users turn to alternatives. You and your team can spend hundreds of hours to improve your websites, add new features, and create great content. If your website comes down at a critical moment, these efforts are wasted and users are left wondering about your business’ ability to function in the digital world.
The Importance of Uptime for Your Website
Business operations have been revolutionized by the advent of web-computing services. Many organizations now look to decrease or eliminate expenditure, increase efficiency, and maximize profits by moving their processes online because of the unmatched flexibility and ability to scale the cloud affords them. With this sea-change to online, cloud-based operations for businesses has come a new challenge: availability.
How the Great Firewall of China Affects Performance of Websites Outside of China
The Great Firewall of China, or as it’s officially called, the Golden Shield Project, is an internet censorship project to block people from accessing specific foreign websites. It is the world’s most advanced and extensive Internet censorship program. This project implements multiple techniques and tactics to censor China’s internet and controls the internet gateways to analyze, filter, and manipulate the internet traffic between inside and outside of China.
WebSocket Application Monitoring
WebSockets have been around for over a decade now, but the real-time web existed long before they came. This preceding ‘real-time’ web was typically slower and hard to achieve. It was attained by hacking available web technologies that were not primarily built for real-time applications. There was no solution with TCP/IP socket-style capabilities in a web environment that could address all concerns associated with operating in a web environment.
Optimizing Web Performance: Understanding Waterfall Charts
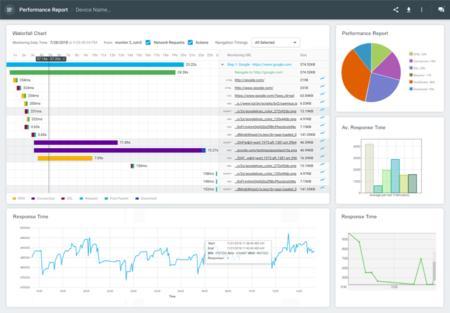
Waterfall charts are diagrams which represent how website resources are being downloaded, parsed by the engine, in a timeline that gives us the opportunity to see the sequence and dependencies between resources. It assists in identifying where important events happened during the loading process. They can also let the user easily see how good or bad the performance of their website is, showing you exactly what is slowing down your site.
The 10 Most Common HTTP Status Codes
As a typical Internet user, nothing is more frustrating than waiting for a web page to display, only to receive a “Page Not Found” 404 error status code. Sure, we try reloading the page, and sometimes that gets the gremlins to start working, but most times, the issue is out of our hands. For all of us typical users, we either go onto the next thing or find a different site. There’s a lot going on in the background that most of us are completely unaware of.
Top 13 Site Reliability Engineer (SRE) Tools
The role and responsibilities of a site reliability engineer (SRE) may vary depending on the size of the organization, and as such, so do site reliability engineer tools. For the most part, a site reliability engineer is focused on multiple tasks and projects at one time, so for most SREs, the various tools they use reflect their eve-evolving responsibilities.


