Operations | Monitoring | ITSM | DevOps | Cloud

Latest Posts

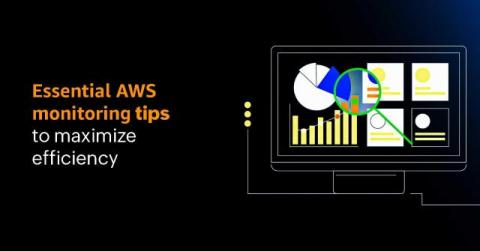
Observe best practices in AWS with our Guidance Report.

Introducing Site24x7's Guidance Report for AWS, your very own personal cloud consultant to help you get the most out of your AWS investment. So, what does this new Guidance Report offer? Well, it helps you follow certain industry best practices related to AWS. How? By checking your AWS account and resources against a list of curated best practice recommendations.

Exception handling and monitoring in ASP.NET

Exception handling is a crucial mechanism of application development. When exceptions occur frequently, things like increased CPU time consumption, memory leakage, and application slowness have a higher chance of happening. In case of uncaught exceptions, the application's run time can terminate. If an application can handle various exception types, it will be more robust and less prone to crashing.

Free Amazon Web Services (AWS) Infrastructure Designer Tool.

Design Amazon Web Services Infrastructure Diagrams For Free. Site24x7's Amazon Web Services (AWS) infrastructure designer tool is a free, online design platform that helps you create and depict your Amazon Web Services architecture. Effortlessly create simple or complex cloud architecture diagrams in a matter of minutes, without even signing up. The Site24x7 AWS infrastructure designer tool has two views: the resource view on the left, and the canvas view in the center, where the action happens.

How to Setup Site24x7's Real User Monitoring (RUM)

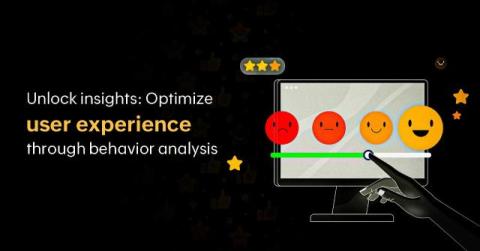
Have you ever wondered if your end-users are truly satisfied with your web applications? Would you like to get accurate insight into end-user experience for better business decisions that will impact your bottom line? ~With Site24x7 Real User Monitoring you can! Get ready to gain real-time visibility into end-user experience ( for ALL users, browsers, devices and geographies) and behind-the-scenes performance for your web application.

Network Configuration Management Best Practices

One of the biggest responsibilities of system administrators and DevOps professionals is ensuring networks are always functioning properly. Network configuration management used to be a simple task. Watch resource usage and make the appropriate tweaks when the occasional traffic spike occurred. Since then, the rise of agile principles within the DevOps field has required system administrators to adapt to rapid shifts in their field.

Easy Debugging with JSON Formatter and Validator - Free Tool

How often do you stare at a JSON string cluster, hoping to interpret it? How many times do you wring your hands in despair, looking for the syntactical error that's causing the chaos? Well, we have some good news for you. We are here to help you cut down the long hours you spend in deciphering these extensive JSON strings.

Two Factor Authentication - What it is and How to implement it

One of the biggest pains of using the internet today is constantly being forced to create new accounts to use basic services on the internet. While many tech savvy users know to use password managers to allow them to create unique strong passwords for each website, the average internet user is much less sophisticated.

Application performance Monitoring - Key to Business Success

Update:~Visualize Web Transactions end to end, with performance metrics of all components starting from URLs to SQL queries with Site24x7 APM Insight Application down-time can be nightmarish Consider you are the owner of an~e-business~portal and due to the slow response time of a search request, a customer decides to move to a competitor's website. That's certainly painful.

Analyze root cause of a downtime with Site24x7 RCA report

Site24x7's Root Cause Analysis (RCA) Report offers valuable insights on the various issues in your IT infrastructure. In this post, we will see how to interpret an RCA report and how to put RCA to optimal use in identifying and addressing performance and network issues. RCA is different from a conventional downtime alert. Conventional downtime alerts contain details like start time of the instance and Traceroute if available, which is sufficient for you to know what has happened.