Operations | Monitoring | ITSM | DevOps | Cloud

Latest Posts

High Scale Postman Load Testing for Kubernetes

In this Postman load testing tutorial, you’ll learn how to run a large scale load test in Kubernetes using your existing Postman collections. Because HTTP services don’t have a graphical user interface, it’s common to build collections of requests using Postman during the development process. These collections are useful for running quick functionality tests as you develop each endpoint.

Stop Using TCP Health Checks for Kubernetes Applications

As developers, one of the most important things we can consider when designing and building applications is the ability to know if our application is running in an ideal operating condition, or said another way: the ability to know whether or not your application is healthy. This is particularly important when deploying your application to Kubernetes. Kubernetes has the concept of container probes that, when used, can help ensure the health and availability of your application.

Considerations When You Mock APIs Inside of Kubernetes

Today it’s not unusual to see organizations having implemented mocking in their daily workflow, as mock APIs allow developers to speed up their development and not rely on external services. For those reasons and others, many engineers are looking to learn more about the mocked APIs and how they can best be implemented into their organization.

Video: Cloud Native Traffic Replay

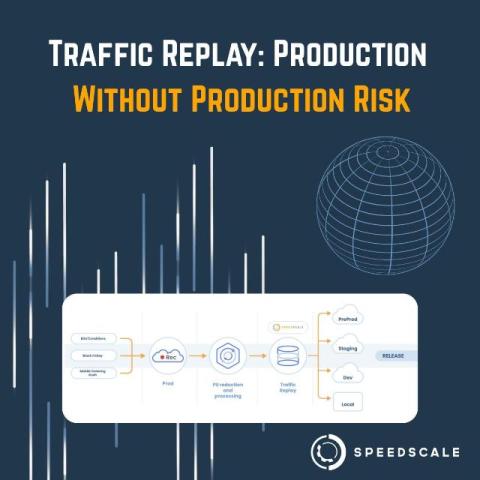
With the introduction of new application platforms like Kubernetes, oftentimes the DevOps tooling around it needs to evolve. Cloud Native technology is powerful but complex. This 5 minute demo video shows how Speedscale provides production simulation capabilities so you can check for resiliency, quality and scalability in your Kubernetes clusters. You can record data and traffic in production and replay sanitized traffic on the fly against a new cluster.
Sponsored Post

Datadog & Speedscale: Improve Kubernetes App Performance

By combining traffic replay capabilities from Speedscale with observability from Datadog, SRE Teams can deploy with confidence. It makes sense to centralize your monitoring data into as few silos as possible. With this integration, Speedscale will push the results of various traffic replay conditions into Datadog so it can be combined with the other observability data. Being able to preview application performance by simulating production conditions allows better release decisions. Moreover, a baseline to compare production metrics can provide even earlier signals on degradation and scale problems. Speedscale joined the Datadog Marketplace so customers can shift-left the discovery of performance issues.

Setting up a Multi-Architecture Kubernetes Cluster

In the last post we covered the industry shift towards ARM machines for both local and production software engineering. Last time we learned how to create Docker images that would work on multiple architectures for dev machines. Now we want to take this portability and leverage it for cost savings in production. You may be able to transition some of your services into multi-architecture builds.

Kubernetes Load Testing Comparison: Speedscale vs K6

In this article, you’ll be introduced to two different load testing tools that are both able to work with Kubernetes; Speedscale and K6. Throughout this post you’ll be given a comparative view of how each tool performs in five different categories: Ease of setup, developer experience, working with the CLI, creating tests, and integration into CI/CD pipelines.

How to Avoid Getting Your Pod OOMKilled

In this blog, understand why your pod has OOMKilled errors when provisioning Kubernetes resources and how Speedscale can aid with automated testing. When creating production-level applications, enterprises want to ensure the high availability of services. This often results in a lengthy development process that requires extensive testing for the applications or a new release.

Sponsored Post

Using Open Source for API Observability

API Observability isn't exactly new, however it's popularity has seen rapid growth in the past few years in terms of popularity. API Observability using open source is different from regular API monitoring, as it allows you to get deeper and extract more valuable insights. Although it takes a bit more effort to set up, once you've got an observability infrastructure running it can be immensely helpful not only in catching errors and making debugging easier, but also in finding areas that can be optimized.