
Operations | Monitoring | ITSM | DevOps | Cloud

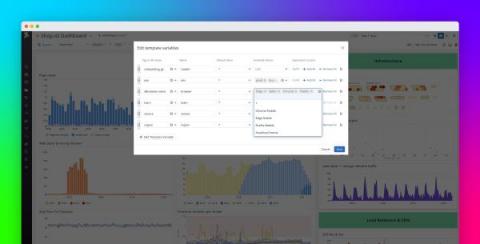
Filter dashboards faster with template variable available values

Datadog’s template variables help you quickly scope your dashboards to specific contexts using tags, so you can visualize data from only the hosts, containers, services, or any other tagged objects you care about. This helps you build more flexible dashboards so you can access the insights you’re looking for as quickly as possible. We’re proud to announce new features for the template variable workflow that enable you to make highly dynamic, shareable dashboards more efficiently.
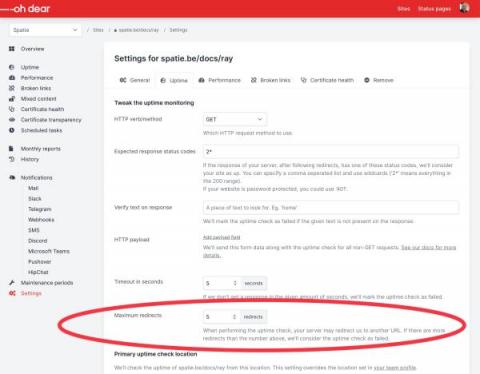

You can now customise how we handle redirects

A good deal of sites redirect visitors to a specific more relevant page. Think, for instance, of a site that redirects you from / to a page in a relevant language, for instance /en or /nl. A single redirect is often not a problem, but having multiple redirects in a chain can hinder your site's user experience. Modern browsers also limit the number of redirects.

Fight the phish using Bubble Wrap

Bubble wrap®. That obsessively addictive plastic material, made up of hundreds of small air-filled bubbles we all love to squeeze. Although I tend to think of Bubble Wrap as the original fidget toy—melting away our anxieties with every satisfying pop—most people associate it with helping to protect their most precious collectibles when in transit or being placed in long-term storage.

Comparing Rails Application Performance Monitoring Tools

Monitoring an application’s performance is the basics of building a successful software product. With the popularity that Rails has always been riding on in the start-up world, it makes all the more sense to look for tools that help you keep your Ruby on Rails application in shape. In this guide, we will look at some of the top APM tools for Rails applications and compare them along some standard benchmarks to help you get an insight into which tool fits your use case the best.

Trigger a Kubernetes HPA with Sysdig metrics

In this article, you’ll learn, through an example, how to configure Keda to deploy a Kubernetes Horizontal Pod Autoscaler (HPA) that uses Sysdig Monitor metrics. Keda is an open source project that allows using Prometheus queries to scale Kubernetes pods. In Trigger a Kubernetes HPA with Prometheus metrics, you learned how to install and configure Keda to create a Kubernetes HPA triggered by a standard Prometheus query.

Trigger a Kubernetes HPA with Prometheus metrics

In this article, you’ll learn how to configure Keda to deploy a Kubernetes HPA that uses Prometheus metrics. The Kubernetes Horizontal Pod Autoscaler can scale pods based on the usage of resources, such as CPU and memory. This is useful in many scenarios, but there are other use cases where more advanced metrics are needed – like the waiting connections in a web server or the latency in an API.

Automate, Group, and Get Alerted: A Best Practices Guide to Monitoring your Code - Part 2

Missed part one? Check out the full guide here. As companies grow, so do their products, teams, and the number of external tools. For engineers, that can mean code sprawl, data silos, notification fatigue, and some “what the…?” moments along the way as they try to make sense of it all.

Debugging CI/CD pipelines with SSH access

In my interactions at industry events like AWS re:invent and KubeCon, I talk with a lot of developers. Devs often tell stories of things that prevent them from working quickly and efficiently. Many involve frustrating interactions with sys admins, SREs, or DevOps colleagues. One story I have heard several times involves a conversation like this: dev: Hey, SRE team. My build is failing and I don’t know what’s happening with the app in the build node.