Jenkins, OpenTelemetry, Observability
If you’re like most organizations, you’re leveraging Jenkins for all sorts of things. Deployment pipelines, automated API tests, even glorified CRON jobs just to name a few.


If you’re like most organizations, you’re leveraging Jenkins for all sorts of things. Deployment pipelines, automated API tests, even glorified CRON jobs just to name a few.
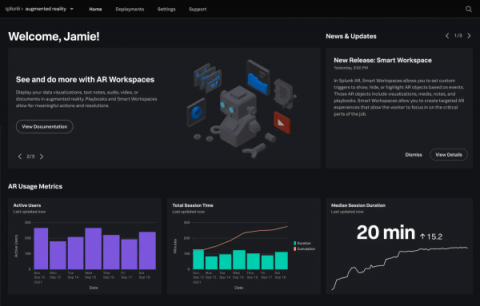
In 2021, Splunk AR is better than ever. We’ve launched many features in both the Splunk AR mobile app and the Splunk App for AR web app. In this blog post, we’ll talk about these updates and go in detail about the exciting features in Splunk AR 4.0 and Splunk App for AR 2.0.
During.conf21, we announced the public release of the Splunk UI Toolkit, a collection of packages and libraries that provides some of the same underlying tools powering our product line to you, the Splunk developer. Now, any Splunk developer can incorporate Splunk UI components into their own custom applications and tools. This includes everything from buttons and inputs from our @splunk/react-ui package, or our new parallel coordinates visualization from our @splunk/visualizations package.
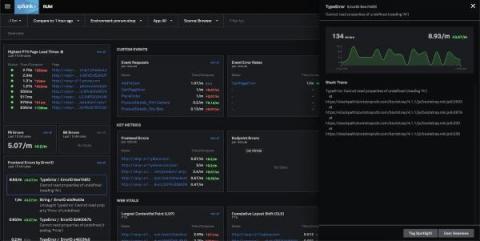
Debugging errors is an essential component to SRE and developer workflows. “How do we prioritize and isolate JavaScript errors more effectively?” is a top challenge we hear from engineering teams looking to improve end-user experience. Therefore, we are excited to announce the general availability of Splunk RUM frontend error monitoring.
When meeting with a current or prospective Splunk customer, one question we are often asked is “Why do I need Splunk when I can just use AWS Cloudwatch, Azure Monitor, or GCP Cloud Operations Suite (formerly known as Stackdriver) for my cloud monitoring needs?” And what a great question it is!
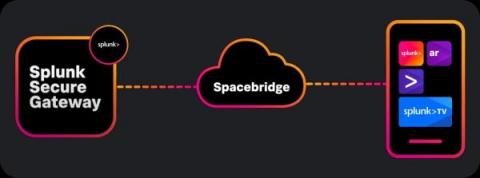
Having Splunk Mobile available in your pocket is great, but what if you're not able to take advantage of it because of Defense Federal Acquisition Regulation Supplement (DFARS) requirements or security concerns? Through this blog post, you'll learn how deploying a Private Spacebridge might be the right answer!
In 2021, any time that you access any kind of web service, whether it be via a website or app, chances are high that the backend is running on Kubernetes. Hundreds of thousands of organizations rely on Kubernetes to power and manage their mission critical services every day, and the reliability and scalability benefits offered by Kubernetes have been felt across the industry.
In our last blog, "Splunk Cloud Self-Service: Announcing the Admin Config Service (ACS)" we introduced our modern, cloud-native API that is enabling Splunk Cloud Platform admins to manage their environments in a self-service fashion. In this blog, we take a look at our latest effort to empower our customers: ACS private app management.