Hello Splunk Nation! Welcome to the latest roundup of Splunk integrations with Microsoft and GitHub! Hopefully, you had a chance to virtually attend.conf21 and check out all the amazing content. For those of you who missed it, we’re recapping the Microsoft, GitHub and Splunk highlights below.
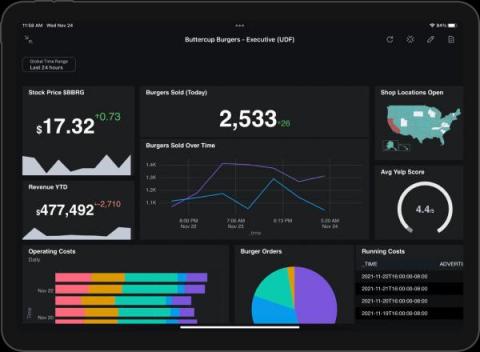
Are you busy and on the go but still need to dig into your data and view your dashboards? We’ve got you covered — introducing… Splunk for iPad! Splunk for iPad is designed for and dedicated to what’s unique and great about the iPad, taking full advantage of its portable and interactive nature with unique dashboard annotation and note-taking features.
Performance is a vital component of user experience. Users will leave—and likely not come back—if your site is slow. If they stay, they’ll be less likely to buy from you if their experience is subpar. To add insult to injury, they’re even less likely to find your app to begin with, since Google punishes poorly-performing sites in the search results. To solve the problem of poor performance, knowledge of what impacts performance is essential.
As an update to.conf’s announcement of our continuous code profiling preview, we’re excited to share that today Splunk APM’s AlwaysOn Profiling is generally available for Java applications, included in APM with no additional cost. Here’s a quick walkthrough of the feature, and how you can get started now.
With Kubernetes emerging as a strong choice for container orchestration for many organizations, monitoring in Kubernetes environments is essential to application performance. Kubernetes allows developers to develop applications using distributed microservices introducing new challenges not present with traditional monolithic environments. Understanding your microservices environment requires understanding how requests traverse between different layers of the stack and across multiple services.