Add observability to cart: How online retailer ASOS reduces MTTR with Grafana Cloud

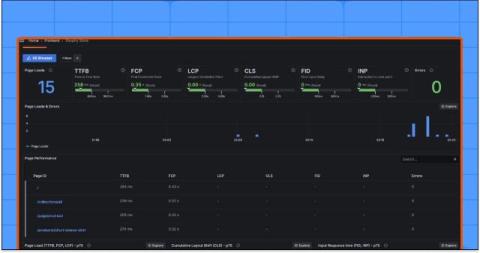
Like the fit your friend got on ASOS? There’s a good chance Grafana Cloud had something to do with that. Each year, more than 20 million customers come to the UK-based online retailer to fill their digital carts, and they expect a seamless online experience as they shop and check out. ASOS can consistently provide that with the help of Grafana Cloud. “There are alerts set up for many of our customer-facing journeys,” said Dylan Morley, Lead Principal Engineer at ASOS.

Adding a Grafana Dashboard to Your Prometheus Setup

This article is part of a series on setting up an end-to-end monitoring and alerting stack using Prometheus. Continuing our series on setting Prometheus in a Docker container, we will add a Grafana instance to our Prometheus setup. Please refer to the previous article where we use docker compose to run Prometheus and Alertmanager together as that forms the basis to run multiple related containers. We will add a container to run Grafana to the same compose file in this article.

Leverage log analytics dashboards for better monitoring

Visuals often communicate better than words, and this is also true for monitoring systems. Dashboards are an essential feature in log monitoring systems, providing great value to those who need to analyze and monitor logs. They help centralize log data in a simple, easy-to-read format, avoid clutter, and allow the team to focus on critical metrics.

FinOps Dashboards: Metrics And Features Every Business Needs For Cost Control

FinOps dashboards help manage cloud financial operations by providing real-time visibility into cloud spending, resource utilization, and cost optimization. They are part of the broader FinOps framework, which combines finance and DevOps practices to improve collaboration between technology, finance, and business teams. This collaboration supports financial accountability and optimizes cloud costs.

Grafana LLM plugin updates: choose the LLM models and providers that work best for you

At Grafana Labs, our mission has always been to empower users with the tools they need to build their own observability solutions. Our big tent philosophy embodies this mission by allowing you to choose the tools and technologies that best suit your needs. In this post, we want to share an update to our LLM plugin that reflects this philosophy in action.

How to securely connect Grafana to Google BigQuery using Workload Identity Federation

Umesh Pawar is a Senior Cloud Engineer at Searce, and is also the co-organizer of the Grafana and Friends Delhi Group. Umesh has been focused on infrastructure and app modernization, as well as observability solutions including the Grafana LGTM Stack, for the past two years. With the Google BigQuery data source plugin for Grafana, you can easily query and visualize data from BigQuery directly in Grafana.

How to Maximize Customer Retention with Grafana Cloud SLOs | Demo | Alert Management | Incidents

In this video, Mark Covelo, a Solutions Engineer at Grafana Labs, demonstrates how Grafana Cloud SLO empowers organizations to improve customer retention by simplifying the adoption of Service Level Objectives (SLOs). SLOs provide critical insights into the customer experience, enabling teams to prioritize and resolve user-impacting issues effectively.