Grafana 7.0 sneak peek: query history in Explore
Grafana 7.0 is coming in May! In the next days and weeks before it launches during GrafanaCONline, we'll be posting sneak previews of new features.


Grafana v7.0 is coming next month! Here’s a sneak peek of one of its features: the query history in Explore. Query history lets you view the history of your querying. All queries that have been starred in the Query history tab are displayed in the Starred tab. This allows you to access your favorite queries faster and to reuse these queries without typing them from scratch.
Since the beginning of the Cortex project, there was a flaw with the ingester service responsible for storing the incoming series data in memory for a while before writing it to a long-term storage backend. If any ingester happened to crash, it would lose all the data that it was holding.
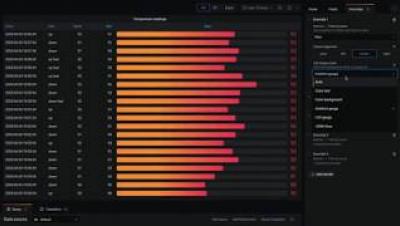
Grafana v7.0 is coming next month! Here’s a sneak peek of one of its features: a brand-new table panel. The current (old) table panel has accumulated a ton of feature requests over the years, and we are excited to finally close many of them in 7.0 with this new table panel. Among the many new things this panel can do is to include other visualizations inside cells. For example, you can configure a cell style (per column) to render the value as a bar gauge.
The COVID-19 pandemic has forced many companies to require employees to work from home. It’s a new normal for many, but at Grafana Labs our team has always recruited and operated with a remote-first culture in mind. To help everyone transition to a home office environment, we launched a new WFH series in which Grafana team members have been sharing their best advice for staying productive at home – yes, even if you have kids around.
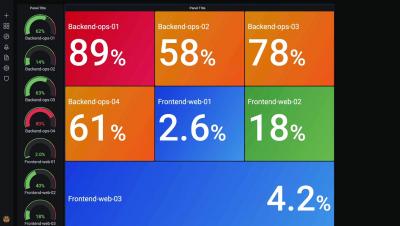
Grafana v7.0 is coming next month! Here’s a sneak peek of one new feature: the auto grid layout. This new 7.0 feature is for the gauge and stat panels. Before, stat and gauge only supported horizontal or vertical stacking: The auto layout mode just selected vertical or horizontal stacking based on the panel dimensions (whatever was highest).
For the majority of the first year that we worked on the Loki project, the questions and feedback seemed to come from people who were familiar with Prometheus. After all, Loki is like Prometheus – but for logs! Recently, however, we are seeing more people trying out Loki who have no Prometheus experience, and many are coming from systems with much different strategies for working with logs.
Did you know that Grafana pairs well with a fine wine? That’s what machine learning company ML6 discovered when they worked with their client Accolade Wines, an award-winning Australian vintner whose goal was to decrease the waste produced in its global operations. “Accolade Wines is really focused on being as efficient as possible,” says Rebecca Brooke, ML6’s team leader in the U.K. “They’re always looking at minimizing their environmental impact.”
In Grafana, Loki isn’t just for log visualization anymore. Now there’s a simple way to use a Loki datasource as a metric datasource in your graphs. This used to require a hack to make it work – adding Loki as a Prometheus datasource – and the process was very tedious. But Grafana v6.6 integrates Loki even better than before. As a result, right out of the box you can create very nice dashboards about your logs, and mix them with your dashboards about metrics.
Histograms are one of my favorite topics in the Prometheus universe. Last November, I delivered a talk at PromCon EU 2019 that was titled Prometheus Histograms – Past, Present, and Future. Only the part about the past had to be cut due to time constraints. But I made a promise to resurrect my talk about the history of histograms and I kept my word. In February, I premiered the Secret History of Prometheus Histograms at FOSDEM 2020.
Hello again! We are Eldin and Christine – or, as our lovely editor has dubbed us, Regis and Kelly – jumping back in for another post. This week, to highlight the big tent and community theme, we are going to write about how our Datadog plugin allows you to “see it all in one place.” Datadog is a popular monitoring and analytics platform that allows you to easily install an agent so you can get started with collecting metrics right away.
The COVID-19 pandemic has forced many companies to require employees to work from home. It’s a new normal for many, but at Grafana Labs our team has always recruited and operated with a remote-first culture in mind. To help everyone transition to a home office environment, we launched a new WFH series in which Grafana team members have been sharing their best advice for staying productive at home – yes, even if you have kids around.
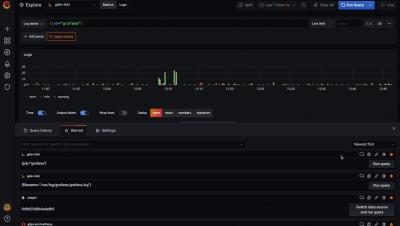
Greetings! This is Eldin and Ronald reporting in from the Solutions Engineering team at Grafana Labs. You’ve probably seen some previous posts from our colleagues Christine and Aengus or maybe some of the fantastic Loki videos that Ward has put up on YouTube. This week, Ronald and I will walk through how to leverage Prometheus and Loki as data sources to create a simple but awesome Grafana dashboard that enables quick searches of logs.
We’re happy to announce that Cortex v1.0 has been released! The horizontally scalable, durable, and fast Prometheus implementation is now generally available for production use. At Grafana Labs, we’ve been using Cortex in production for almost three years, including to power the Prometheus backend for the Grafana Cloud managed logging and metrics platform.
It has been a little over 2 months since 1.3.0 was released. We started prepping for the 1.4.0 release several weeks ago; however, when I was writing this very blog post for the release, we discovered some confusing stats from the new statistics objects (which we’ll talk about in a bit). After sorting that out, we played the usual game of, “Wait, don’t release yet!