Operations | Monitoring | ITSM | DevOps | Cloud

September 2020

Announcing Streama: Get complete monitoring coverage without paying for the noise

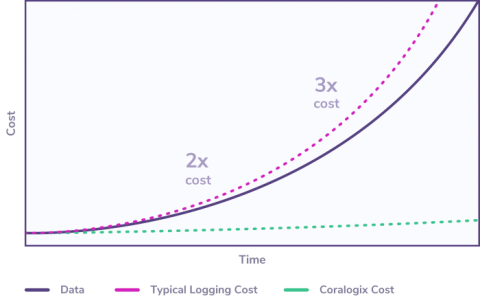
With the new Streama capability announced today, you no longer have to choose what to monitor and what to drop to manage your logging costs. For years, our customers have enjoyed the benefits of a log analytics platform that enables them to autonomously manage and analyze data in their cloud applications. Our machine learning engine empowers users to improve their system stability and accelerate their release cycles.

ELK Stack: 5 Common ELK Issues and How to Fix Them

Running an ELK stack provides unrivaled benefits for your organization, however, ELK issues will inevitably crop up. ELK is scalable, and largely agnostic of internal infrastructure, making it a great asset for SMEs and enterprises. However, successfully deploying and running an ELK stack is not without its difficulties. In order to keep your ELK stack running at optimum performance, you need to familiarize yourself with some of the most common ELK issues.

Aggregate Data with Elasticsearch Data Frames

Ingesting various events and documents into Elasticsearch is great for detailed analysis but when it comes to the common need to analyze data from a higher level, we need to aggregate the individual event data for more interesting insights. This is where Elasticsearch Data Frames come in. Aggregation queries do a lot of this heavy lifting, but sometimes we need to prebake the aggregations for better performance and more options for analysis and machine learning.

Is your team spending too much time on log maintenance?

Log maintenance has a hidden cost. Engineers optimize their instance types, storage, networking, dependencies, and much more. However, we rarely consider the engineers themselves. A DevOps culture encourages engineers to own the solutions they build. While this increases team autonomy, it risks splitting the precious bandwidth that the team has. Automation is what makes the DevOps cycle work, and it has to cover log analysis to do a thorough job of catching issues.

Logging Cost: Are you paying the same for all of your logs?

Fundamentally, there are logs that will be of intrinsic value to you, and others that are less business-critical. Are you aware of the logging cost to handle, analyze and store these different types of logs? Should you really have the same approach for mission-critical logs as you do for info or telemetry logs? Differentiating your approach for different logs is challenging. If no two logs are truly the same then why should you treat them the same?

Essential Observability Techniques for Continuous Delivery

Observability is an indispensable concept in continuous delivery, but it can be a little bewildering. Luckily for us, there are a number of tools and techniques to make our job easier! One way to aid in improving observability in a continuous delivery environment is by monitoring and analyzing key metrics from builds and deploys. With tools such as Prometheus and their integrations into CI/CD pipelines, gathering and analysis of metrics is simple. Tracking these things early on is essential.

Are you on top of newly introduced errors in your CI/CD releases?

Log files are infamous for being “noisy”. Without the right management solution, trying to find a specific piece of information or using them to reproduce a critical error is a complex undertaking. If you’re working with CI/CD, how do you attribute new errors to a particular release? How do you investigate those errors and make sure that your customers aren’t being impacted? Faster releases mean shorter development and testing cycles before new code reaches production.

Java Logging: Best Practices for Success with your Java Application

Java is used by at least 7.6 Million developers worldwide. Java logging has been a staple of the Java platform since day one, boasting extensive, resourceful documentation and rich API’s. The cornerstone of monitoring your application is efficient and widespread logging. At Coralogix, we know that logs have become one of the most important components of a modern monitoring function.

Are you paying too much for your logging solution?

The cost of logging is one of the big problems of a scaled software system. Logging solutions now need to support far more than they ever have. You need to make a real investment in a logging solution that can support these initiatives. However, the up-front costs of a custom-built logging solution are prohibitive for many organizations. No business wants its bottom line affected by logging costs. That’s where Coralogix comes in.

.NET Logging: Best Practices for your .NET Application

Logging is a key requirement of any production application. .NET Core offers support for outputting logs from your application. It delivers this capability through a middleware approach that makes use of the modular library design. Some of these libraries are already built and supported by Microsoft and can be installed via the NuGet package manager, but a third party or even custom extensions can also be used for your .NET logging.