Operations | Monitoring | ITSM | DevOps | Cloud

June 2020

Filebeat Configuration Best Practices Tutorial

In this post, we will cover some of the main use cases Filebeat supports and we will examine various Filebeat configuration use cases. Filebeat, an Elastic Beat that’s based on the libbeat framework from Elastic, is a lightweight shipper for forwarding and centralizing log data. Installed as an agent on your servers, Filebeat monitors the log files or locations that you specify, collects log events, and forwards them either to Elasticsearch for indexing or to Logstash for further processing.

Elasticsearch Performance Tuning - Index Design

You’ve created the perfect design for your indices and they are happily churning along. However, in the future, you may need to reconsider your initial design. Maybe you want to improve performance, change sharding settings, adjust for growth. Whatever the reason, Elasticsearch is flexible and allows you to change index settings to improve your Elasticsearch Performance Tuning. Let’s see how to do that!

Using Log Data to Prevent Lambda Cold Starts

AWS Lambda enables you to run serverless functions in the AWS cloud, by manually triggering functions or by creating trigger events. To ensure your Lambda functions are running smoothly, you can monitor metrics that measure performance, invocations, and concurrencies. However, even if you continuously monitor, once in a while you are going to run into what’s termed a Lamba cold start. There are various ways to prevent AWS Lambda cold starts.

Protect Your AWS Infrastructure with GuardDuty and Coralogix

Cloud environments like AWS can be a challenge for security monitoring services to operate in since assets tend to dynamically appear and disappear. Making matters more challenging, some asset identifiers that are stable in traditional IT environments like IP addresses are less reliable due to their transient behavior in a cloud service like AWS. Amazon GuardDuty protects your AWS environment with intelligent threat detection and continuous monitoring.

Integrating Coralogix Alerts with PagerDuty

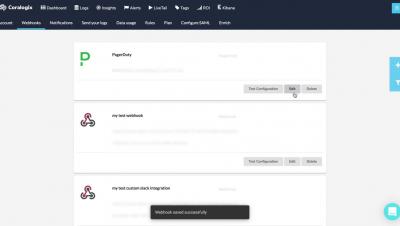
Coralogix offers the most extensive alerting mechanism in the logging market, including built-in webhooks for PagerDuty, custom webhooks, and automatic resolve notifications. PagerDuty is a leader in digital operations management. In an always-on world, organizations of all sizes trust PagerDuty to help them deliver a perfect digital experience to their customers, every time.

Logstash Grok Tutorial with Examples

Logstash can parse CSV and JSON files easily, but that’s because data in those formats are perfectly organized and ready for Elasticsearch analysis. Sometimes, though, we need to work with unstructured data, like plain-text logs for example. In these cases, we’ll need to parse the data to make it structured data using Logstash Grok. This tutorial will enable you to take full advantage of Elasticsearch’s analysis and querying capabilities by parsing with Logstash Grok.

Advanced Guide to Kibana Timelion

Kibana Timelion is a time-series based visualization language that enables you to analyze time-series data in a more flexible way. compared to other visualization types that Kibana offers. Instead of using a visual editor to create visualizations, Timelion uses a combination of chained functions, with a unique syntax, to depict any visualization, as complex as it may be.