Operations | Monitoring | ITSM | DevOps | Cloud

April 2023

Root cause analysis with logs: Elastic Observability's AIOps Labs

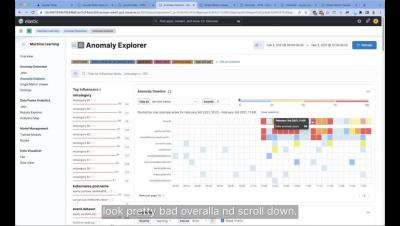
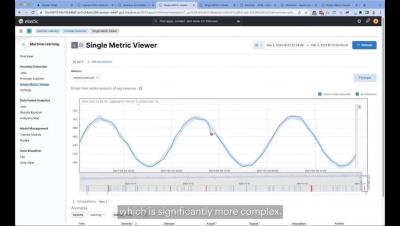
In the previous blog in our root cause analysis with logs series, we explored how to analyze logs in Elastic Observability with Elastic’s anomaly detection and log categorization capabilities. Elastic’s platform enables you to get started on machine learning (ML) quickly. You don’t need to have a data science team or design a system architecture. Additionally, there’s no need to move data to a third-party framework for model training.

Log monitoring and unstructured log data, moving beyond tail -f

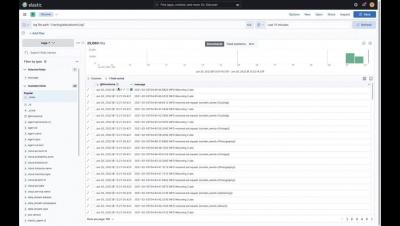
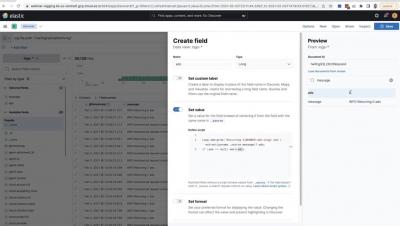
Log files and system logs have been a treasure trove of information for administrators and developers for decades. But with more moving parts and ever more options on where to run modern cloud applications, keeping an eye on logs and troubleshooting problems have become increasingly difficult. Watch this video to learn how to go beyond tail -f and process custom and unstructured logs with Elastic.

How to add support for more languages in your Elastic Enterprise Search engines

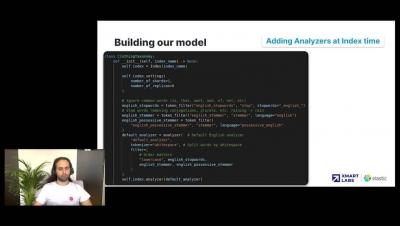
Engines in Elastic App Search enable you to index documents and provide out-of-the-box, tunable search capabilities. By default, engines support a predefined list of languages. If your language is not on that list, this blog explains how you can add support for additional languages. We’ll do this by creating an App Search engine that has analyzers set up for that language.

Monitoring service performance: An overview of SLA calculation for Elastic Observability

Elastic Stack provides many valuable insights for different users. Developers are interested in low-level metrics and debugging information. SREs are interested in seeing everything at once and identifying where the root cause is. Managers want reports that tell them how good service performance is and if the service level agreement (SLA) is met. In this post, we’ll focus on the service perspective and provide an overview of calculating an SLA.

Elastic Common Schema and OpenTelemetry - A path to better observability and security with no vendor lock-in

At KubeCon Europe, it was announced that Elastic Common Schema (ECS) has been accepted by OpenTelemetry (OTel) as a contribution to the project. The goal is to achieve convergence of ECS and OpenTelemetry’s Semantic Conventions (SemConv) into a single open schema that is maintained by OpenTelemetry. This FAQ details Elastic’s contribution of Elastic Common Schema to OpenTelemetry, how it will help drive the industry to a common schema, and its impact on observability and security.

Using Elastic Anomaly detection and log categorization for root cause analysis

Elastic's machine learning helps support several easy-to-use features to help determine root cause analysis for logs. This includes anomaly detection and log categorization, which are easy-to-use features aiding in analysis without the need to understand or know about machine learning.

Monitor OpenAI API and GPT models with OpenTelemetry and Elastic

ChatGPT is so hot right now, it broke the internet. As an avid user of ChatGPT and a developer of ChatGPT applications, I am incredibly excited by the possibilities of this technology. What I see happening is that there will be exponential growth of ChatGPT-based solutions, and people are going to need to monitor those solutions.

Joins, pipes and more with the new Elasticsearch Query Language

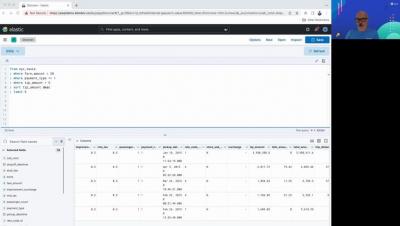
The new Elasticsearch Query Language is a flexible, powerful, and robust query expression language to interrogate data. In this session learn how ESQL provides a superior query UX, a piped query language with join capabilities that fundamentally transforms and expands the analytics and data processing of Elasticsearch.

Elasticsearch and OpenSearch - not the same thing

Do you understand the differences between Elasticsearch and OpenSearch? We’ll lay them out for you. You’ll find that our take on emerging technologies is fundamentally transforming the opportunity to solve problems through search. Learn about innovation in areas like vector search and hybrid scoring or support for third-party natural language processing that help you unlock possibilities for new classes of searches through the application of machine learning. The result? Increased relevance with less burden on the developer and administrator. In this session, you'll learn all about these innovations, and how you can take advantage of them to drive success.

Using search effectively in taxonomies and correctly modeling your domain in Elasticsearch

Finding matches when using a taxonomy is a common problem. A notable challenge is mapping a user’s query to the entity (or results) expected when searching for an entity inside a catalog mapping. Functional textual search models tend to rely on exact match or partial match, but both can lead to a frustrating experience when users aren’t familiar with the domain. Basic models often fail to support user typos, synonyms, acronyms, and/or hyponyms/hypernyms. Learn how to tackle these challenges and make search more intuitive when using a taxonomy.

How to monitor Kafka and Confluent Cloud with Elastic Observability

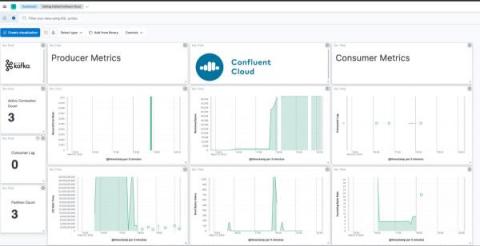
The blog will take you through best practices to observe Kafka-based solutions implemented on Confluent Cloud with Elastic Observability. (To monitor Kafka brokers that are not in Confluent Cloud, I recommend checking out this blog.) We will instrument Kafka applications with Elastic APM, use the Confluent Cloud metrics endpoint to get data about brokers, and pull it all together with a unified Kafka and Confluent Cloud monitoring dashboard in Elastic Observability.