Operations | Monitoring | ITSM | DevOps | Cloud

August 2024

New GenAI Search Revamps Customer Experience

Splunk has launched a GenAI summary feature in splunk.com and docs.splunk.com search platforms designed to give users a quick and accurate glance of the most pertinent information they are looking for. This GenAI feature serves up a contextual high-level summary pulled from various relevant search results on topics ranging from Splunk product and feature usage to general Splunk terminology.

Introduction to Splunk Synthetic Monitoring in Splunk Observability Cloud

In this video I’m going to introduce you to Splunk Synthetic Monitoring in Splunk Observability Cloud. I’ll explain what synthetic monitoring is and then demonstrate a simple example by creating a browser test for a sample e-commerce site. I’ll also demonstrate how you can link issues found through synthetic monitoring with backend code due to its integration with Splunk APM.

Introduction to Log Observer Connect in Splunk Observability Cloud

Log Observer Connect will allow you to connect to and view/query logs from your Splunk Enterprise or Splunk Cloud instance from within Splunk Observability Cloud. In this video, I will introduce you to Log Observer Connect in Splunk Observability Cloud and walk you through a demonstration of how it works. You’ll learn how to view and query logs, as well as save queries for later use. I’ll also walk you through a practical example of when you might use Log Observer Connect through the use of Related Logs.

Setup Log Observer Connect in Splunk Observability Cloud

Log Observer Connect will allow you to connect to and view/query logs from your Splunk Enterprise or Splunk Cloud instance from within Splunk Observability Cloud. In this video, I will briefly explain what Log Observer Connect is and then show you how to connect your Splunk Observability Cloud organization to a Splunk Enterprise instance through Log Observer Connect. TOC.

Observability Meets Security: Build a Baseline To Climb the PEAK

When we hunt in new environments and datasets, it is critical to build an understanding of what they contain, and how we can leverage them for future hunts. For this purpose, we recommend the PEAK Threat Hunting Framework's baseline hunting process.

What Is Five 9s in Availability Metrics?

What comes to mind when you hear that an IT component has “five 9s availability”? Five 9s availability of >= 99.999% is the peak metric for IT availability. Five 9s predicts that a measured component — whether it is a server, communication line, app, service, or any other item — will be available at least 99.999% of the time during a specific period.

Splunk Named a Leader in the Gartner Magic Quadrant for Observability Platforms

"Transformative Solution" says a Director of IT in a $30B+ retailer. "Best Monitoring and Observability Tool > Splunk," is how a software engineer in a software company labels it. These are only a couple of the terms our customers use when describing the value they are getting from Splunk. With these descriptions in mind, we are elated that Splunk has been named a Leader in the 2024 Gartner Magic Quadrant for Observability Platforms for the second year in a row in this category.

Introduction to K8s Horizontal Pod Autoscaling | Monitor Autoscaling in Splunk Observability Cloud

In this video, I’m going to introduce you to Horizontal Pod Autoscaling in Kubernetes and monitoring autoscaling events in Splunk Observability Cloud. I’ll first walk through our simple application deployment definition. We will analyze the metrics of that application in Splunk Observability cloud, identifying that the application is under resource pressure. I’ll then discuss the scaling options at our disposal, and we will walk through an implementation of a Horizontal Pod Autoscaler that will automatically scale our pods according to the load they are receiving.

An Overview of the OpenTelemetry Collector's Configuration File

In this video, I’ll provide an overview of the OpenTelemetry Collector’s configuration file (config.yaml) with examples from the Splunk distribution. I will briefly explain the components of the Splunk OTel Collector, and walk you through a sample generic configuration of the OTel Collector. We’ll then use the Splunk Observability Cloud interface to construct the commands needed to install the Splunk OTel Collector on a specific host. This installation will copy a default Splunk OTel Collector configuration onto the host, and we’ll review the Splunk specific components of this configuration.

Unlock the Value of Cloud: Introducing Splunk Cloud Value Calculator

In the rapidly evolving digital landscape, organizations are increasingly turning to the cloud powered with AI capabilities to enhance efficiency, scalability and innovation. Splunk, a leader in security and data observability, has been at the forefront of this transformation.

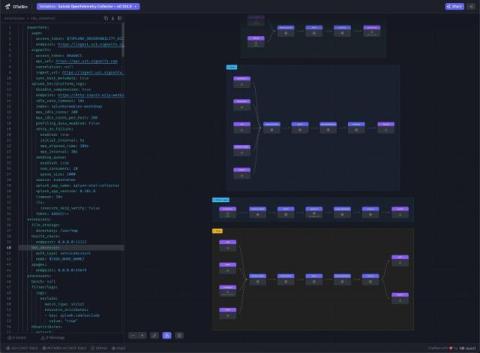
Setting up and Understanding OpenTelemetry Collector Pipelines Through Visualization

Observability provides many business benefits, but comes with costs as well. Once the (not-insignificant) work of picking a platform, taking an inventory of your applications and infrastructure, and getting buyin from leadership (both from the business and engineering sides of the house) is done, you then have to actually instrument your applications to emit data, and build the data pipeline that sends that data to your observability system.