Operations | Monitoring | ITSM | DevOps | Cloud
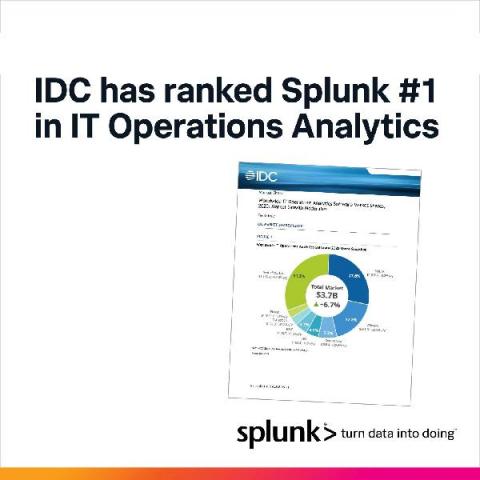
Expanded Customer Adoption Lands Splunk First in 2020 IT Operations Analytics Market Share Report
For the 7th year in a row, IDC has ranked Splunk as #1 in ITOA*. We’re thrilled with this news, but let me start by saying that our success is due to the continued success of our customers, and we’re very grateful for the opportunity to be a part of it. Need a refresher on ITOA? We know we know, another day another acronym. ITOA is IT Operations Analytics. IDC derived this market from portions of their IT Operations management (ITOM) software market.
Splunk Delivers Real-Time Salesforce Visibility with New Streaming API Integration
You might already be using Splunk to manage your Salesforce environment with the help of the Splunk App for Salesforce and the Splunk Add-on for Salesforce that allows a Splunk administrator to collect different types of data from Salesforce using REST APIs. This solution is great and the events give you an idea of how users interact with Salesforce. These events can range from Apex executions to page views.
Grey's Academy 301: Intel (OpenVino)
Morgan McLean on Splunk's Enthusiasm for OpenTelemetry
Volume, velocity, variety, and variability - Arijit Mukherji on Splunk Observability Cloud
Scale for fully automated Kubernetes monitoring in minutes
The Path to Innovation for Public Sector Is Through Data
It’s never been more important for government agencies to embrace innovation than over the past 18 months. Citizens are relying on our government more than ever to provide critical services during the global pandemic — from developing COVID-19 vaccines at warp speed to extending benefits to the record number of unemployed Americans. The pandemic not only made government services more critical, it also challenged agencies’ ability to deliver those services.
What Is Distributed Tracing and Why You Need It
It is no surprise that monitoring workloads are top of mind for many organizations to ensure a successful customer experience. As our applications become more distributed and cloud-native, we find that monitoring can become more complex. A single user transaction fans out to interact with tens or hundreds of microservices, each one requesting data from backend data stores or otherwise interacting with each other and other parts of your infrastructure.
Workload Pricing and SVCs: What You Can See and Control
The Cloud Monitoring Console (CMC) lets Splunk Cloud Platform administrators view information about the status of a Splunk Cloud Platform deployment. For workload pricing, the CMC lets you monitor usage and stay within your subscription entitlement. From the CMC you can see both ingest and SVC usage information and can gain insight into how your Splunk Cloud Platform deployment is performing.
What is Splunk Virtual Compute (SVC)?
A Splunk Virtual Compute (SVC) unit is a powerful component of our workload pricing model. Historically, we priced purely on the amount of data sent into Splunk, leading some customers to limit data ingestion to avoid expense related to high volumes of data with low requirements on reporting. With Splunk workload pricing, you now have ultimate flexibility and control over your data and cost.
Product Explainer Video Short: Splunk Infrastructure Monitoring for Real-time Cloud Monitoring
Top Devops Tools: 10 Essential Tools for Actual Practitioners
Nowadays, the efficiency of a company’s IT infrastructure is commonly measured in how often it can deploy new versions of the software. Faster, better deployments are one of the main goals of the DevOps mindset. Therefore, to not fall behind the competition, one needs to implement DevOps practices. But DevOps isn’t just about deploying fast and often. DevOps is a set of practices and tools that help deliver better-quality software faster. The “quality” is the key here.
Grey's Academy 201: O11y (Observability Suite)
Turning Data into Doing
Understanding Cardinality in a Monitoring System and Why It's Important
The journey to becoming cloud-native comes with great benefits but also brings challenges. One of these challenges is the volume of operational data from cloud-native deployments — data comes from the cloud infrastructure, ephemeral application components, user activity, and more. The increased number of data sources does not only increase datapoint volume – it also requires that monitoring systems store and query against data with higher cardinality than ever before.


