Operations | Monitoring | ITSM | DevOps | Cloud

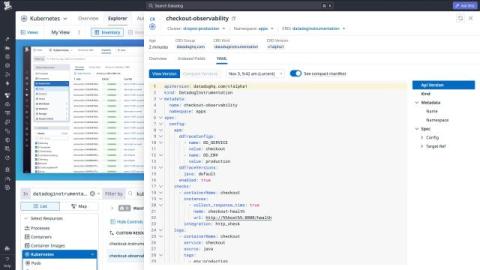
Manage Kubernetes observability with DatadogInstrumentation

For teams that own an application running on Kubernetes, updating its observability configuration should be as straightforward as updating any other Kubernetes resource. But configuring integration checks, log collection, and tracing often means working across multiple configuration paths. If those settings live in pod annotations, adding a metric check or changing log processing rules requires a Deployment rollout.
Highlights from Oracle AI World 2026

Oracle AI World 2026 brought customers and partners to Las Vegas to explore how AI can support their existing business systems. At the event, Datadog participated in a session with Peloton Consulting Group and hosted a booth covering observability across Oracle Fusion Cloud Applications, Oracle Database, and Oracle Cloud Infrastructure (OCI).

Compare AI agent changes with Online Experiments in Agent Observability

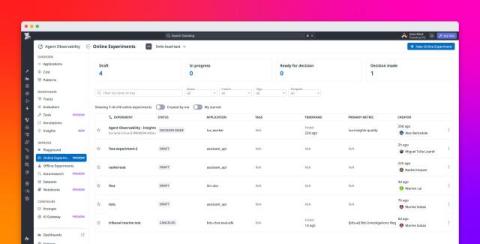
Improving an AI agent often involves changing its prompts, models, retrieval methods, or tools. But determining whether those changes actually improve performance can be difficult. A revised prompt might produce better answers for a handful of test cases but perform poorly on unexpected user requests. A cheaper model might reduce token costs while introducing tool-calling errors or longer execution times.

Evaluate your AI agents with Fireworks AI models in Datadog Agent Observability

Teams that build agents on open models hosted on Fireworks AI, such as GPT-OSS, Kimi, GLM, Qwen, and MiniMax, need a reliable way to measure whether their LLM applications and agents are giving accurate, safe, and helpful answers efficiently. Datadog Agent Observability now supports Fireworks AI as a model provider, so you can get end-to-end visibility into your agents built on Fireworks AI, from traces and token usage to quality evaluations.

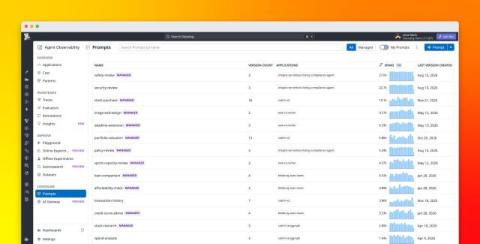
Manage and deploy LLM prompts with Datadog

Prompts are an important part of LLM application behavior, but teams often manage them alongside application code or across separate notebooks and configuration files. This can make prompt changes dependent on application releases and make it difficult to understand which version is running in each environment. When a change affects application quality, latency, or cost, teams also need a way to connect that behavior back to the prompt version that produced it.

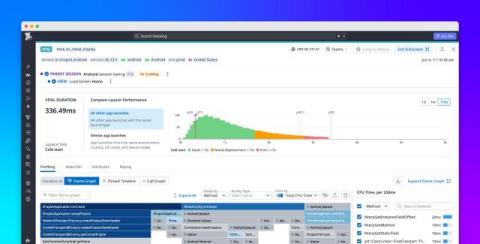
Diagnose frontend performance issues with RUM Profiling

When a mobile application takes too long to launch or becomes unresponsive, it can be difficult to find the cause. Datadog Real User Monitoring (RUM) helps developers detect these issues and understand which users are affected. But knowing that an application is slow doesn’t tell you which part of its code is responsible. Engineers often need to reproduce the problem locally, piecing together performance metrics and code execution information from separate tools.

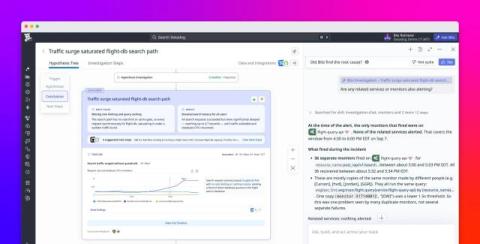
Bits investigations are faster, more accurate, and cost less

When we launched Bits Investigation in December 2025, our goal was to give teams an always-on agent that could investigate every alert and reduce mean time to resolve (MTTR). Since then, we’ve focused on making Bits faster, more cost effective, and even more accurate. At launch, the average investigation cost $25 and took 11 minutes.