Operations | Monitoring | ITSM | DevOps | Cloud

June 2019

Kubernetes Control Plane monitoring with Datadog

In a Kubernetes cluster, the machines are divided into two main groups: worker nodes and master nodes. Worker nodes run your pods and the applications within them, whereas the master node runs the Kubernetes Control Plane, which is responsible for the management of the worker nodes. The Control Plane makes scheduling decisions, monitors the cluster, and implements changes to get the cluster to a desired state.

Lessons learned from running Kafka at Datadog

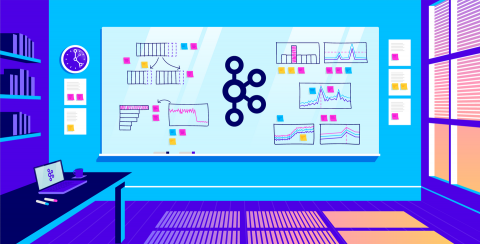
At Datadog, we operate 40+ Kafka and ZooKeeper clusters that process trillions of datapoints across multiple infrastructure platforms, data centers, and regions every day. Over the course of operating and scaling these clusters to support increasingly diverse and demanding workloads, we’ve learned a lot about Kafka—and what happens when its default behavior doesn’t align with expectations.

Explore your data in full-screen graph mode

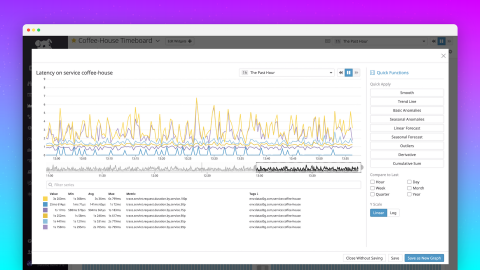
As you navigate through Datadog, you may find that you want to dive into a graph to explore your timeseries data more deeply, or make quick changes to a graph without permanently altering it. To make it easier to explore the data in your graphs, we’re excited to introduce a newly revamped full-screen view for our timeseries graphs. You can now quickly and easily apply functions, navigate through time to find anomalies, and save and share your work.

Monitor IBM DB2 with Datadog

IBM DB2 is a database management system that runs on a wide range of technologies, including Linux, UNIX, Windows, mainframes, and IBM Power Systems. You can use DB2 as a managed service in the cloud or deploy it in a cluster to provide high availability, making it suitable for a wide range of enterprise and customer-facing applications.

Java runtime monitoring with JVM metrics in Datadog APM

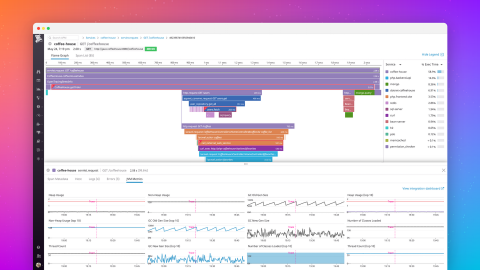
Whether you’re investigating memory leaks or debugging errors, Java Virtual Machine (JVM) runtime metrics provide detailed context for troubleshooting application performance issues. For example, if you see a spike in application latency, correlating request traces with Java runtime metrics can help you determine if the bottleneck is the JVM (e.g., inefficient garbage collection) or a code-level issue.

Integrate Akamai with Datadog to monitor CDN performance

Akamai is a leading provider of content delivery network solutions around the world, handling many millions of HTTP requests per second. By Akamai’s estimates, its CDN platform delivers 15 to 30 percent of global web traffic. If you’re using Akamai to accelerate and protect the delivery of content to your users, we are pleased to announce that you can now use Datadog to monitor the utilization and performance of your CDN.