Operations | Monitoring | ITSM | DevOps | Cloud

August 2022

Get the Most Out of Serverless for Fleet Management Apps

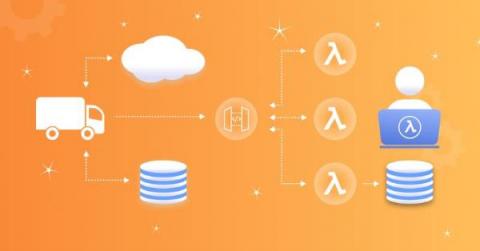
You’ve probably seen Rush Hour, a logic puzzle where you have to slide cars and trucks out of the way to steer the red car towards the exit. In real life, when your customers are responsible for tracking hundreds or thousands of data points from dozens of valuable, mission-critical sensors, you’re tracking engine speed, network signal level, distance from the RF, and more—and not just through traffic but across continents.

Shine Some Light on Your SNS to SQS to Lambda Stack

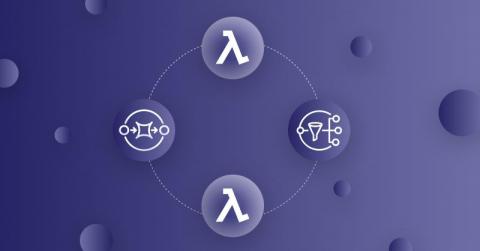
The combination of SNS to SQS to Lambda is a common sight in serverless applications on AWS. Perhaps triggered by messages from an API function. This architecture is great for improving UX by offloading slow, asynchronous tasks so the API can stay responsive. It presents an interesting challenge for observability, however. Because observability tools are not able to trace invocations through this combination end-to-end. In X-Ray, for example, the trace would stop at SNS.

Advanced Debugging and Monitoring for Serverless Backends

Serverless backends have different monitoring challenges when compared with traditional applications, mostly due to the distributed and proprietary nature of serverless. Making monitoring and debugging efficient for serverless requires a unique set of tools and techniques. In this article, we’ll discuss the challenges of debugging serverless backends and how to utilize third party tools to improve the monitoring process.

Seven Tools to Help You Become a Better Serverless Developer

Serverless technologies let us do more with less effort, time and energy. They let us focus on creating user value and let the cloud handle undifferentiated heavy-lifting like scaling and securing the underlying infrastructure that runs our code. Serverless technologies have allowed me to accomplish tasks as a solo engineer that used to take a whole team of engineers to accomplish, and I’m able to complete these tasks in a fraction of the time and cost to my customers.

Top Tips for NodeJS and Debugging on AWS Lambda (Part 2)

This is the second post in a 2 part blog series on debugging, monitoring and tracing NodeJS Lambda applications. If you haven’t yet seen part 1, check it out here (it’s a great read!) Now let’s get back into our post with one of the most commonly experienced issues when it comes to Lambda functions, Cold Starts.

Quick Bytes - Lumigo Alerts

Lumigo Alerts allows you to create customized alerts for anything lumigo monitors, including event-based alert (e.g., timeout) and key metrics (e.g., error rate). The alerts can delivered via email or a multiple of platform integration options like slack, Microsoft teams and more. Make sure to subscribe so you don't miss out on any new livestreams and observability content! With one-click distributed tracing, Lumigo lets developers effortlessly find and fix issues in serverless and containerized environments

Lumigo for Colorcast: A Game of Metrics

At sports tech company Colorcast, debugging was running out the clock for their developers. They made a game-time decision to automate their tracing and monitoring, knocking out their average time to debug. Watch how they did it with Lumigo. Make sure to subscribe so you don't miss out on any new livestreams and observability content! With one-click distributed tracing, Lumigo lets developers effortlessly find and fix issues in serverless and containerized environments

Top Tips for NodeJS Tracing and Debugging on AWS Lambda (Part 1)

In this two post series, we are going to explore some ways to trace and debug NodeJS Lambda applications. Delving into some methods to look further into resources utilized to and some methods to optimize code. AWS Lambda, an event-driven compute service first introduced roughly eight years ago, changed how we build out cloud applications as an industry.