Operations | Monitoring | ITSM | DevOps | Cloud

Icinga

Icinga Web - Not just Black and White

Most of you know that Icinga Web can be adjusted by themes. Some of you also have made some! Icinga Web itself comes with several themes since the early days. Now with the next upcoming major update v2.10 we’ll take themes to their next evolution. But since we’ve postponed this feature, much additional work has gone into it, which I want to outline today. There will be some general hints for module/theme development as well.

Releasing Icinga for Windows v1.8.0 - The Power of Rework

Today we are happy to announce that after month of work we finally can release Icinga for Windows v1.8.0. As discussed in our live Icinga for Windows Q&A on our YouTube-Channel, we spent lots of time resolving issues reported by our community and customers and in general improved the performance as well.

Icinga L10n - The Future is Here

It’s soon two years since I’ve introduced you to Icinga L10n. There I’ve talked about a place on-line to ease collaboration. So, without further ado, let me introduce you to translate.icinga.com! We’re using Weblate on there and hope that interested users may already be familiar with it. The basic tools are easy to grasp though. And even if not, it has an extensive user documentation.

Introduction to (Performance) Monitoring Metrics

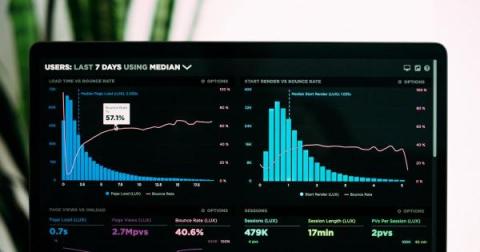
To ensure the reliability and stability of your services, it’s essential to understand the overall health of your infrastructure and systems. That variety of information from your systems helps you to get a proper context during your root cause investigation and react in real time. But also gives you the ability to make changes with confidence, so you don’t encounter the same problem in the future.

How the IT service provider q.beyond thrives with Icinga

We are proud of our many customers and users around the globe that trust Icinga for critical infrastructure monitoring. That´s why we´re now showcasing some of these enterprises with their Success stories. It´s stories from companies or organizations just like yours, of any size and different kinds of industries. Some of them are our long-standing customers, others have just recently profited from migrating from another solution to Icinga.

Why you need network monitoring?

Network monitoring is a continious analysis of a network to detect and correct any performance issues. Network monitoring involves collecting network statistics to determine the quality of services offered by the network. With tools like Icinga, it’s possible to monitor hardware and software in your network. Espacially in the pandemic when many employees work from home, it’s good to have a tool which checks the network permanently.

Replay Log in Distributed Icinga Environments

An essential part of a distributed monitoring environment with Icinga that includes master, satellite and agent nodes is the replay log functionality. The replay log is a built-in mechanism to ensure nodes in a distributed setup keep the same history e.g. check results, notifications and downtimes if nodes are temporarily disconnected and then reconnect.

Introducing Icinga Module for vSphere - Releasing version 1.2

One of the pillars of Icinga is integrations. With it’s open APIs and various extensions, Icinga is capable of integrating seamlessly into your existing infrastructure. Today I want to give you an introduction to our VMware integration and share some details about the latest release. The Icinga Module for vSphere® is an Icinga module dedicated to collecting, monitoring and visualizing data from your VMware environment.