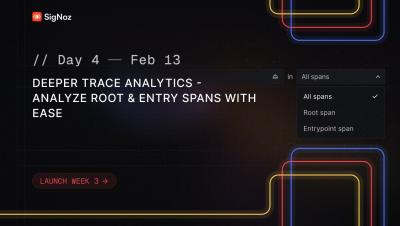
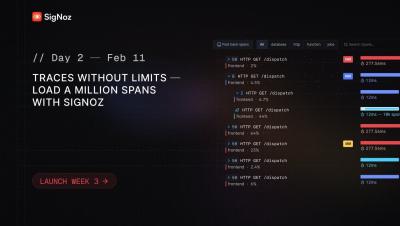
Operations | Monitoring | ITSM | DevOps | Cloud

OpenTelemetry-Powered Infrastructure Monitoring - SigNoz Launch Week 3.0 Day 1

Today, we’re excited to announce a much-awaited feature in SigNoz: Infrastructure Monitoring. With our latest OpenTelemetry-powered Infra Monitoring, we bring you a native OpenTelemetry experience that seamlessly integrates infrastructure metrics with application performance data.

Out-of-the-box OpenTelemetry-powered Kafka & Celery monitoring | SigNoz Launch Week 3.0 Day 3

Today, we are excited to announce OpenTelemetry-powered messaging queue monitoring in SigNoz. Debugging issues in Kafka and Celery queues has traditionally been a black box, with limited correlation between message producers, consumers, and broker metrics. With our messaging queue monitoring, teams can correlate Kafka broker metrics with OpenTelemetry spans, enabling deep insights into consumer lag, throughput, drop rates, and performance bottlenecks.

OpenTelemetry-Powered Infrastructure Monitoring

Today, we’re excited to announce a much-awaited feature in SigNoz: Infrastructure Monitoring, built natively on OpenTelemetry. Infrastructure monitoring is a critical aspect of modern observability. Without proper visibility into your infrastructure resources, troubleshooting issues, optimizing costs, and maintaining performance become challenging.

The Ultimate Guide to API Monitoring in 2025 - Metrics, Tools, and Proven Practices

According to Akamai, 83% of web traffic is through APIs. Microservices, servers, and clients constantly communicate to exchange information. Even the Google search you made to reach this article involved your browser client calling Google APIs. Given APIs govern the internet, businesses rely on them heavily. API health is directly proportional to business prosperity. This article covers everything about API monitoring, so your API infrastructure’s health is always in check .

DataDog vs Prometheus - Comprehensive Comparison Guide [2025]

Both DataDog and Prometheus are application monitoring tools aimed to improve application performance. While Datadog is a cloud-based SaaS solution, meaning there's no need to install or maintain any infrastructure, Prometheus is an open-source tool that requires manual download and installation on your infrastructure. Let us compare DataDog and Prometheus to see which tool suits The biggest difference between Datadog and Prometheus is that while Prometheus is open-source, Datadog is proprietary.

Kibana vs. Grafana - A Scenario-Based Decision Guide [2025]

Both Kibana and Grafana are data visualization tools providing users capabilities to explore, analyze and visualize data with dashboards. The difference between Kibana and Grafana lies in their genesis. Kibana was built on top of the Elasticsearch stack, famous for log analysis and management. In comparison, Grafana was created mainly for metrics monitoring supporting visualization for time-series databases.

Top 14 ELK alternatives [open source included] in 2025

ELK is the acronym Elasticsearch, Logstash, and Kibana, and combined together, it is one of the most popular log analytics tools. Elastic changed the license of Elasticsearch and Kibana from the fully open Apache 2 license to a proprietary dual license. The ELK stack is also hard to manage at scale. In this article, we will discuss 14 ELK alternatives that you can consider using.