Operations | Monitoring | ITSM | DevOps | Cloud

Request Metrics

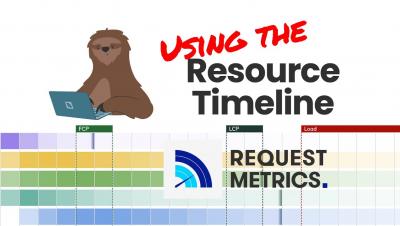
Using the Resource Timeline in Request Metrics

The Resource Timeline in Request Metrics is a heat map of all the files requested by your pages. It shows the range of resource load time and critical load events experienced by all users, not just a single point load. The data allows you to see which resources impact your page metrics as well as the variability in their load time.

Crazy Like a Fox: Redis as Your Primary Database

Redis is fast. It’s fast because the data is all in memory. Persistence options are limited. Because of this, many people say, “Redis is for transient data only!” However, sometimes the need for speed and ease of operations can outweigh the durability downsides! In this talk, we look at a real SaaS business using Redis as its (only) datastore. You’ll learn why we decided to go all-in on Redis and the challenges we faced. You’ll learn how we operationalized the setup, handle backups and restores, and how we’ll scale out. Are we making a terrible mistake? You be the judge!

Fix Your First Contentful Paint (FCP): Cheat Sheet

Are slow FCP scores getting you down? Worried that website performance is frustrating your users and hurting your SEO rankings? This FCP cheat sheet has all the tactics (with links) you’ll need to have screaming-fast FCP scores. First Contentful Paint (FCP) is a measurement of how long it takes to show the user the first bit of content. Measuring FCP encourages your website to respond quickly to requests so that users know their request has been received.

Using First Contentful Paint (FCP)

First Contentful Paint, or FCP, measures the time take to render the first element of a webpage. It’s a modern, user-centric measurement of how fast users see a response from your website. Here’s everything you need to know about the metric and how to use it. FCP is one of the Core Web Vital performance metrics that measure user’s perceived performance of websites. These metrics are incredibly important to delivering fast user experiences, and avoiding SEO performance penalties.

How Hacker News Crushed DavidWalshBlog

Earlier this month, David’s heartfelt posting about leaving Mozilla made the front page of Hacker News. Traffic increased by 800% to his already-busy website, which slowed and eventually failed under the pressure. Request Metrics monitors performance and uptime for David’s blog, and our metrics tell an interesting story. Here’s what happened, why, and what you can do to prepare your site for traffic surges.

Tutorial: Monitoring Your Core Web Vitals

Web performance used to be easy. You’d time how long a page takes to load, easy. But the rise of client-side JavaScript has introduced bold new ways for websites to be frustratingly slow. Measuring this new slowness will take new metrics. Google calls them the Core Web Vitals. Each of the Core Web Vitals measures a different aspect of how a web application responds. This post will take a look at each of these metrics, what they measure, and how to use them.

The Limitations of Lighthouse

Google Lighthouse helps you identify page performance issues. It generates an overall performance “score” to make you feel good (or bad) about your site’s speed. This score can be useful, but has some limitations. Lighthouse is an automated tool for assessing web page quality. It generates metrics for performance, SEO, accessability and more. Google has been promoting it as THE way to measure website quality.

Vital Web Performance

I hate slow websites. They are annoying to use and frustrating to work on. But what does it mean to be “slow”? It used to be waiting for document load. Then waiting for page ready. But with so many asynchronous patterns in use today, how do we even define what “slow” is? The W3C has been working on this with the new Event Timing and Element Timing API, and has defined some new Web Vital metrics to describe the different ways that slow performance can impact a webpage.