Operations | Monitoring | ITSM | DevOps | Cloud

Sending metrics to MetricFire

Monitoring IT resources is part of the daily activities in large and medium-sized companies, but smaller companies also benefit from the advantages of monitoring systems, memory capacity, availability, and performance. The aim of such proactivity is to ensure smooth processes - for example, IT administrators need to know days in advance that disk space is becoming too low, so they can do something about it.

Remote Prometheus Monitoring using Thanos

In a previous blog we learnt about setting up a Scalable Prometheus-Thanos monitoring stack. We also learnt about how we can cluster multiple Prometheus servers with the help of Thanos and then deduplicate metrics and alerts across them. MetricFire is a Hosted Prometheus solution, and you can use our product with minimal configuration to gain in-depth insight into your environments. If you would like to learn more about it please book a demo with us, or sign up for the free trial today.

Migrating to TimescaleDB

Here at MetricFire we’re moving some huge rocks to get more benefits for our customers. Our tech team is migrating our Graphite backend from a Riak database to TimescaleDB. This will drive huge benefits for our customers stemming from the new ability to access their database through PostgreSQL querying. Simultaneously, we’ll be migrating our cloud provider from Hetzner to AWS. This drives further benefits surrounding latency, uptime and security requirements for our customers.

How to Reduce Your AWS Costs

Amazon Web Services (AWS) is a comprehensive cloud computing platform, providing an array of services to manage a business’s data infrastructure to help it grow and expand. With the wide range of services provided, it has multiple options to provide you with an elastic approach to optimize your costs. However, many users struggle with controlling their expenditure due to a variety of factors. Getting a complete understanding of how to reduce your AWS operational costs may be a daunting task.

StatsD: What Is It and How To Monitor It

StatsD is among the most popular monitoring solutions used to instrument code with the help of custom metrics. It has become very popular over the course of the last few years and emerged as the industry standard for open source inside-the-app monitoring. It has a host of advantageous features that makes it perfect for application performance measurements.

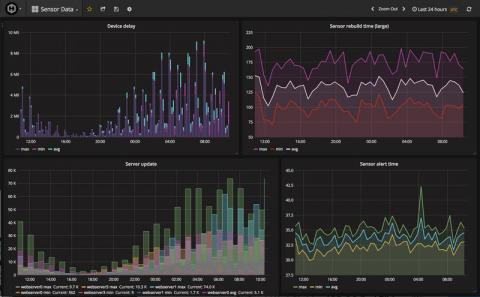
What is Prometheus?

In recent times, Prometheus has become the standard for application monitoring in the tech space. But what exactly is Prometheus? Over the course of this article, we’ll touch on various subtopics to help answer this question, ranging from where it all started, to its architecture and how exactly it does monitoring. We'll address the various possible integrations/tools that can be used alongside Prometheus, and why Prometheus is a great tool for monitoring these platforms and applications.

Monitoring MongoDB Performance

In this article, you’ll learn the basics of MongoDB. We’ll cover its performance metrics, built-in monitoring commands, utilities and tools, and common monitoring strategies. You will also be introduced to a monitoring tool called MetricFire and provided with some examples of how it can be used in production systems together with setup instructions.

Introduction to Performance Monitoring Metrics

The reliability and stability of your services directly depend on how well you understand the state of your infrastructure and services. A great monitoring system will allow you to understand your infrastructure better. Monitoring the performance of your system allows you to not only fix current problems but also make changes to your infrastructure to avoid them in the future.

Monitoring RabbitMQ With Prometheus and Grafana

Prometheus and Grafana are powerful monitoring solutions. Combined together, you can build insightful monitoring metrics and display analysis on a beautiful dashboard. Among many external systems and applications, you can also monitor RabbitMQ with both toolkits. To integrate RabbitMQ into your Prometheus and Grafana, you can try MetricFire that provides hosted solutions for Prometheus and Grafana.

Best Monitoring Tools for Hadoop

Apache Hadoop is an open-source software framework that can process and distribute large data sets across multiple clusters of computers. Hadoop was designed to break down data management workloads over a cluster of computers. It divides data processing between multiple nodes, which manages the datasets more efficiently than a single device could. Here is our list of the best Hadoop monitoring tools.