Operations | Monitoring | ITSM | DevOps | Cloud

MetricFire

SQL Server Monitoring: What metrics to track

SQL Server Monitoring has become an essential part of modern-day applications since a major chunk of these applications rely heavily on a database. It is therefore important to monitor your metrics and make the best out of your database services. SQL Server Monitoring offers plenty of metrics to choose from. We will be breaking down the five key categories that an SQL server provides for a comprehensive view of their functionality.

Top 8 Web Application Performance Metrics

Web application performance metrics help determine certain aspects that impact the performance of an application. This article discusses eight key metrics, including: Web performance is rapidly evolving, with new trends like Google’s Core Web Vitals (CWV), increasing use of images and video on web pages, and the rollout of 5G. We’ll present three methods that can help you adapt to these changes and boost the performance of your web applications.

Using ClickHouse with MetricFire

In the analytics domain, fast and reliable storage is an important aspect for businesses to handle a large amount of data. There are different types of data storage including RDBMS, NoSQL, data lake, data warehouse, and graph database. Among these, the most widely used is RDBMS that powers various systems and applications of companies of all sizes. RDBMS is easy to use and straightforward to understand thanks to its table-based (or column-based) data format.

A Modern Guide to MySQL Performance Monitoring

According to results from the Stack Overflow Developer Survey 2022, nearly half (46%) of respondents say they use MySQL, making it the most widely-adopted database technology among developers today. This popularity is due in no small part to MySQL’s unique features that help it handily meet the needs of modern applications, from small software projects to business-critical systems.

Making the Most of CloudWatch Log Insights: 7 Best Practices

Amazon CloudWatch provides Log Insights, a feature that can help you: CloudWatch Log Insights uses a proprietary query language with several basic commands. It provides sample queries for common AWS service log types, as well as query auto-completion. Learn more about CloudWatch Log Insights capabilities and how to use them.

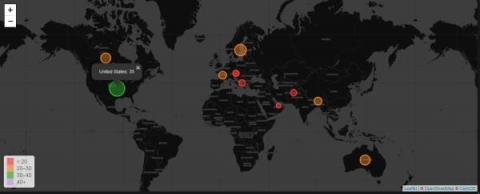
Grafana Worldmap Panel

Grafana Worldmap is a free-of-cost panel used to display time-series metrics over a world map. Users can choose to visualize their data based on cities, states, countries, or any other segregation they like as long as they have a coordinate for each data point. Each data point comes in the form of circles that vary in size depending on the value of data and can get color-coded as per thresholds.

Redis: Open Source vs. Enterprise

Are you curious about the difference between open-source Redis and Redis enterprise? Of course, Redis Enterprise is a hosted service that runs Redis db on behalf of its customers, while open-source Redis is available for anyone to use. However, there's also a key difference between open source and enterprise in how the clusters are implemented. In order to understand the difference, we need to know what Redis Clusters are. ‍

Grafana vs. Chronograf and InfluxDB

How can you judge Grafana vs. Chronograf and InfluxDB? Monitoring various systems is a crucial component of continuous maintenance. You can look at different parameters of the monitored system and take corresponding actions for certain conditions. For example, engineers can prevent server failure when they see the load on the server approaching its critical point. If the numbers of processed transactions (or registered users) exceed the expected level, you can celebrate your success.

Kafka performance monitoring metrics

In this article, we will analyze what are the metrics for monitoring Kafka performance and why it is important to constantly monitor them. We will also look at the process of monitoring metrics for Kafka using Hosted Graphite by MetricFire. To learn more about MetricFire, book a demo with the MetricFire team or sign up for the free trial.

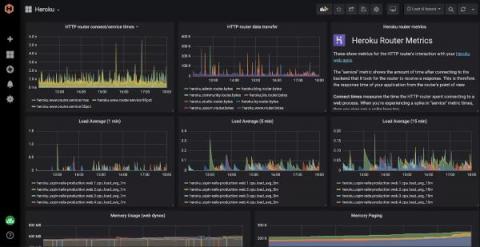
Installing the HG Heroku Monitoring & Dashboards Add-on

HG or HostedGraphite provides a complete infrastructure and application monitoring platform from a suite of open-source monitoring tools. Depending on the setup, you can choose Hosted Graphite as your data source and view all required metrics on beautiful Grafana dashboards in real time. Hosted Graphite offers a wide range of tools, add-ons, and plugins that make it possible to measure, analyze, and visualize large amounts of data about your applications with ease.