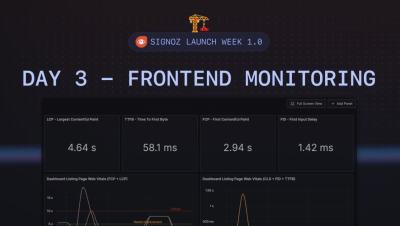
Operations | Monitoring | ITSM | DevOps | Cloud

SigNoz Launch Week - Day 4 - Logs Pipeline

For day 4, we will showcase the recent work we have done in Logs Pipeline. With Log Pipelines, you can transform logs to suit your querying and aggregation needs before they get stored in the database. Pipelines provide a way to modify the structure and content of log data without needing to change application code or redeploy components. By extracting relevant attributes from logs, pipelines enable more efficient analysis.

SigNoz Launch Week - Day 3 - Frontend Monitoring

Welcome to SigNoz Launch week! In day 3 we will focus on monitoring frontend with SigNoz. We will take examples on how to monitor web vitals of your application and monitoring errors in client applications. This will be followed by a discussion with our maintainers on nuances of building performant frontend application for data dense products like SigNoz. Do tune in!

SigNoz Launch Week - Day 1 - Logs Explorer

Welcome to SigNoz Launch Week 1.0! This is our first launch week, and we’re excited to introduce you to some cool new features in SigNoz. We ship fast but often miss sharing the story behind these features with our community. Launch week for us is an opportunity to share the behind-the-scenes of new features that we have built in the recent past. Our open-source maintainers will share the story on the whats, whys, and hows of new upgrades to SigNoz!

Monitoring Kafka with OpenTelemetry including client side monitoring

In this video, you will see a demo of how to monitor Kafka with OpenTelemetry. We will instrument a NodeJS application using Kafka and get client side metrics like delay between producer emitting a message to consumer receiving it via distributed tracing. We will also get Kafka server metrics like consumer lag and plot it dashboards.

Livestream: Client side monitoring & metrics for Kafka using OpenTelemetry & SigNoz

In this livestream, we will walk through a demo of how to get client side insights from Kafka using distributed tracing. We will take a NodeJS producer and consumer setup communicating via Kafka to show how one can instrument this with OpenTelemetry, and get metrics from a client perspective. We will also touch on getting Kafka metrics using OpenTelemetry receivers.

RabbitMQ monitoring with OpenTelemetry

More about SigNoz: SigNoz - Monitor your applications and troubleshoot problems in your deployed applications, an open-source alternative to DataDog, New Relic, etc. Backed by Y Combinator. SigNoz helps developers monitor applications and troubleshoot problems in their deployed applications. SigNoz uses distributed tracing to gain visibility into your software stack. If you need any clarification or find something missing, feel free to raise a GitHub issue with the label documentation or reach out to us at the community slack channel.

OpenTelemetry vs Jaeger : Comparing Apple and Oranges

Open telemetry works with all the three signals i.e. it help in generating all the three signals while Jaeger only focuses on one signal (traces). The second key difference is Jaeger doesn't worry about generating data. It's more focused on the UI visualization long term storage of traces data while OpenTelemetry primarily focused on generating traces data.