
Operations | Monitoring | ITSM | DevOps | Cloud

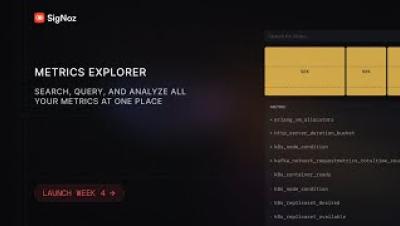
Metrics Explorer - Search, Query, and Analyze all your Metrics at one place

Ever tried to build a metrics dashboard and thought, “Wait, what metrics am I actually sending?” We heard this from users again and again-so we built Metrics Explorer. For the first time, you get a real-time, interactive view of every metric coming into your system: Whether you’re onboarding a new integration, debugging an alert, or just exploring your data, Metrics Explorer makes it easy to understand and work with your metrics-no more guesswork, just clarity.
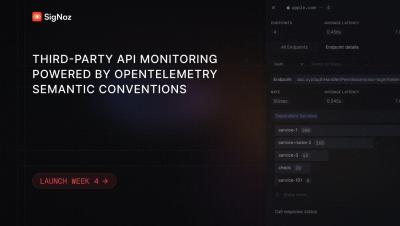
Third party API Monitoring Powered by OpenTelemetry Semantics

Is it the third-party API or my code? Your service suddenly slows down, or errors spike, and you’re stuck guessing if it’s your own logic or an external API you don’t control. We’ve seen this pain across teams: dashboards don’t tell you which vendor or endpoint is the culprit, and debugging turns into a maze of guesswork. Rate limiting, vendor errors, or integration issues often slip through until users complain.

Deeper Trace Analytics - Quickly search through all spans, entry spans and root spans

Debugging distributed systems can often feel like searching for a needle in a haystack. When issues arise, devs need faster ways to pinpoint critical spans within their traces. With our latest Deeper Trace Analytics update, we now enable powerful filtering for root and entry spans — making it significantly easier to analyze and debug distributed traces.

Deeper Trace Analytics - Analyze Root & Entry Spans with Ease | SigNoz Launch Week 3.0 Day 4

Debugging distributed systems can often feel like searching for a needle in a haystack. When issues arise, devs need faster ways to pinpoint critical spans within their traces. With our latest Deeper Trace Analytics update, we now enable powerful filtering for root and entry spans — making it significantly easier to analyze and debug distributed traces.

OpenTelemetry-Powered Infrastructure Monitoring - SigNoz Launch Week 3.0 Day 1

Today, we’re excited to announce a much-awaited feature in SigNoz: Infrastructure Monitoring. With our latest OpenTelemetry-powered Infra Monitoring, we bring you a native OpenTelemetry experience that seamlessly integrates infrastructure metrics with application performance data.

Out-of-the-box OpenTelemetry-powered Kafka & Celery monitoring | SigNoz Launch Week 3.0 Day 3

Today, we are excited to announce OpenTelemetry-powered messaging queue monitoring in SigNoz. Debugging issues in Kafka and Celery queues has traditionally been a black box, with limited correlation between message producers, consumers, and broker metrics. With our messaging queue monitoring, teams can correlate Kafka broker metrics with OpenTelemetry spans, enabling deep insights into consumer lag, throughput, drop rates, and performance bottlenecks.