Operations | Monitoring | ITSM | DevOps | Cloud

Release webinar: SquaredUp v5.6

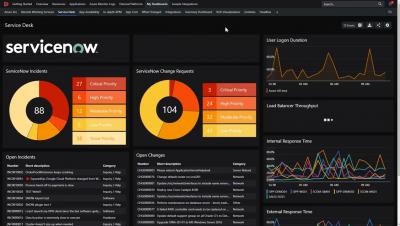
SquaredUp v5.6 is all about the most highly requested features from our customers. Amongst all the improvements, you’ll see the new Tree View and Sunburst visualisations to help you spot root cause more quickly across your SCOM environment, Enterprise Applications and EAM-X monitored objects. Tune into this release webinar to see the new features in action!


Fixing SCOM Blind Spots - Introducing EAM-X, and loads more with SquaredUp v5.5!

In this webinar you’ll learn about all the latest updates included in SquaredUp v5.5, as well as an exclusive demo of our brand new licence tier, EAM-X. What is EAM-X? EAM-X is a new tier of SquaredUp built to extend SCOM’s visibility beyond Microsoft’s domain, making it the ultimate single pane of glass! Have you ever had an outage because of a dependency not monitored by SCOM? Even with Management Packs, SCOM has blind spots, and blind spots = business risk.

Dashboard Fridays: Sample M365 dashboard

In this latest Dashboard Fridays episode, join our VP of Innovation Adam Kinniburgh as he showcases this M365/O365 dashboard built with SquaredUp. This summary dashboard built for the MP using SCOM Edition gives a clear overview of your M365/0365 health, including: subscriptions, consumed licences, network issues, teams performance, mail flow duration and more. This dashboard pack also includes a bunch of cool perspectives with dedicated views (open and closed alerts, metrics, health) for different components, including licencing, teams, alerts and more.

Dashboard Fridays: Sample SQLFacts dashboard

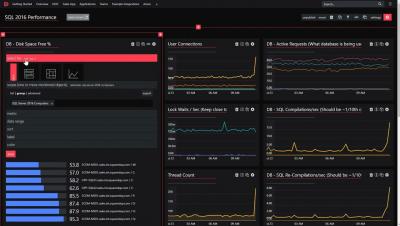
The ugly truth when working with SQL Server is that there usually isn’t much money left over for monitoring once you pay for the license. Most DBAs accept this reality by implementing a custom data collection. But what happens when all you want is to visualize that data quickly? Tune into our latest Dashboard Fridays video to see this SQLFacts dashboard built to visualize the powerful suite of free tools.

Dashboard Fridays: Sample Salesforce dashboard

In our latest Dashboard Fridays episode we showcase this sample Salesforce metrics dashboard built using SquaredUp. Pulling data from Salesforce, this dashboard provides visibility of new business performance for the entire company. Accessed individually or viewed on an office wallboard – all employees from Engineering, Marketing, Sales and Finance can stay up to date with latest sales performance data.

Dashboard Fridays: Log Analytics VM Updates

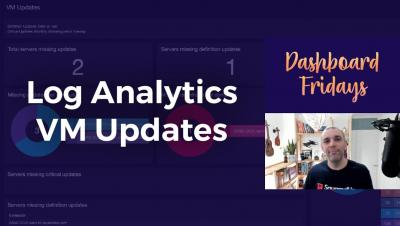
Join Adam Kinniburgh in this latest Dashboard Fridays episode, in which he showcases this VM Updates dashboard, built with the WebAPI tile for the CE and SCOM editions. Since there is a native connection to the Log Analytics workspace in the Azure edition, here it is created using the native Logs tile. This dashboard surfaces key metric data for Virtual Machines, regardless of where the servers are hosted.