Operations | Monitoring | ITSM | DevOps | Cloud

Latest Posts

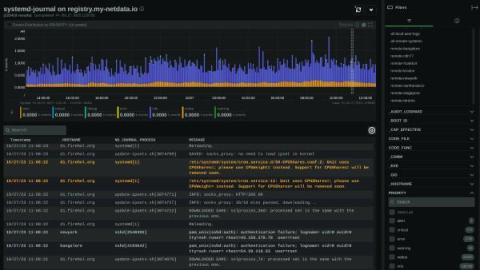
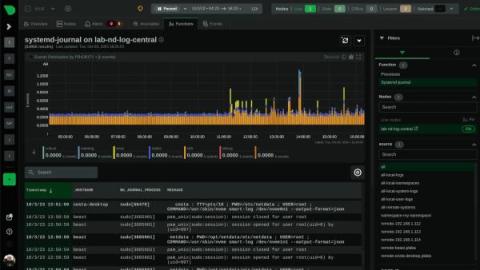
systemd journal logs: A Game-Changer for DevOps and Developers

“Why bother with it? I let it run in the background and focus on more important DevOps work.”— a random DevOps Engineer at Reddit r/devops In an era where technology is evolving at breakneck speeds, it's easy to overlook the tools that are right under our noses. One such underutilized powerhouse is the systemd journal. For many, it's a mere tool to check the status of systemd service units or to tail the most recent events (journalctl -f).

Netdata, Prometheus, Grafana Stack

In this blog, we will walk you through the basics of getting Netdata, Prometheus and Grafana all working together and monitoring your application servers. This article will be using docker on your local workstation. We will be working with docker in an ad-hoc way, launching containers that run /bin/bash and attaching a TTY to them. We use docker here in a purely academic fashion and do not condone running Netdata in a container.

Netdata Processes monitoring and its comparison with other console based tools

Netdata reads /proc//stat for all processes, once per second and extracts utime and stime (user and system cpu utilization), much like all the console tools do. But it also extracts cutime and cstime that account the user and system time of the exit children of each process. By keeping a map in memory of the whole process tree, it is capable of assigning the right time to every process, taking into account all its exited children.

Netdata QoS Classes monitoring

Netdata monitors tc QoS classes for all interfaces. If you also use FireQOS it will collect interface and class names. There is a shell helper for this (all parsing is done by the plugin in C code - this shell script is just a configuration for the command to run to get tc output). The source of the tc plugin is here. It is somewhat complex, because a state machine was needed to keep track of all the tc classes, including the pseudo classes tc dynamically creates. You can see a live demo here.

Our first ML based anomaly alert

Over the last few years we have slowly and methodically been building out the ML based capabilities of the Netdata agent, dogfooding and iterating as we go. To date, these features have mostly been somewhat reactive and tools to aid once you are already troubleshooting. Now we feel we are ready to take a first gentle step into some more proactive use cases, starting with a simple node level anomaly rate alert. note You can read a bit more about our ML journey in our ML related blog posts.

Netdata & Ansible example: ML demo room

We are always trying to lower the barrier to entry when it comes to monitoring and observability and one place we have consistently witnessed some pain from users is around adopting and approaching configuration management tools and practices as your infrastructure grows and becomes more complex. To that end, we have begun recently publishing our own little example ansible project used to maintain and manage the servers used in our public Machine Learning Demo room.

The Hidden Costs of Monitoring

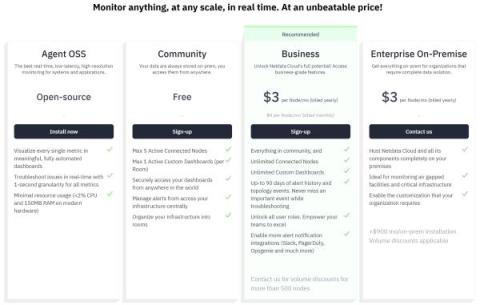
When it comes to monitoring IT infrastructure, the costs you see on the price tag of the tool are often just the tip of the iceberg. Below the waterline, a mass of hidden costs can lurk, which can significantly affect the total cost of ownership. In this blogpost we will cover the analysis of two traditional monitoring domains, Open Source observability and Commercial Centralized observability solutions, focusing the direct and indirect impacts when implementing these solution.