Operations | Monitoring | ITSM | DevOps | Cloud

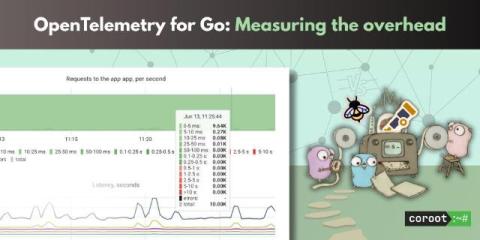
OpenTelemetry for Go: measuring the overhead

Everything comes at a cost — and observability is no exception. When we add metrics, logging, or distributed tracing to our applications, it helps us understand what’s going on with performance and key UX metrics like success rate and latency. But what’s the cost? I’m not talking about the price of observability tools here, I mean the instrumentation overhead.
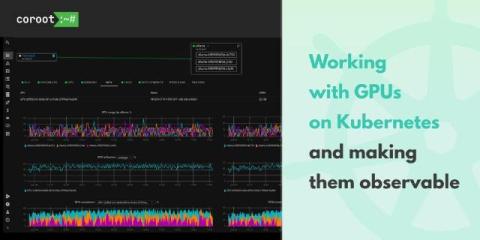

Working with GPUs on Kubernetes and making them observable

GPUs are everywhere powering LLM inference, model training, video processing, and more. Kubernetes is often where these workloads run. But using GPUs in Kubernetes isn’t as simple as using CPUs. You need the right setup. You need efficient scheduling. And most importantly you need visibility. This post walks through how to run GPU workloads on Kubernetes, how to virtualize them efficiently, and how Coroot helps you monitor everything with zero instrumentation or config.

Real-Time Observability with ClickHouse, Coroot, and GlassFlow

Coroot is excited to feature an editorial from GlassFlow for our first Open Source Spotlight. We hope to improve the workflow of our global community of SREs and DevOps professionals by sharing exciting projects like Glassflow, which make innovation accessible for everyone through the freedom of open source. If you have an open source or open core project you’d like to see on our blog next, send us a message!

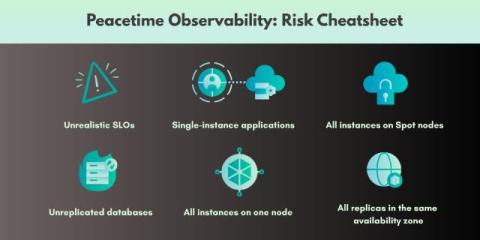
Peacetime Observability: Spotting Risks Before They Become Incidents

Most of the time, nothing’s broken. Traffic’s flowing, alerts are quiet, and everything seems fine. That’s peacetime, when no one’s getting paged. Coroot helps in both peacetime and wartime. When things go wrong, it guides you to the root cause fast. But during peacetime, it helps you spot risks early, clean up inefficiencies, and prevent those incidents from happening in the first place.

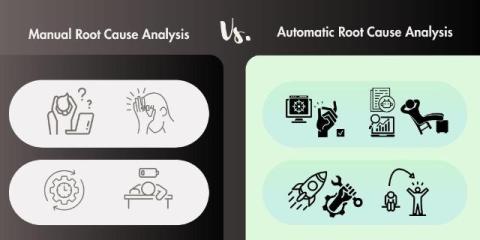
We built AI-powered Root Cause Analysis that actually works

Figuring out why things break still sucks. We’ve got all the data: metrics, logs, traces, but getting to the actual root cause still takes way too long. Observability tools show us everything, but they don’t really tell us what’s wrong. So why do we even need to automate root cause analysis? First, time. Outages are expensive. And if your system has hundreds or thousands of services, digging through everything by hand just takes way too long.

Troubleshooting Java Applications with Coroot

Java applications run on top of the JVM — a powerful but complex runtime environment that re-implements many OS features. It has its own memory management, garbage collector, and dynamic code compiler (JIT). While these features help with performance and portability, they often make troubleshooting a real challenge. At Coroot, we recently improved our support for continuous profiling in JVM-based applications.

Team-Oriented Observability with Coroot

Modern apps are built by many teams, each owning a different set of services: APIs, background jobs, databases, platform components, and more. As the system grows, it gets harder for each team to focus on what actually matters to them.When everything is mixed together, dashboards get messy, service maps are too large to be useful, and alerts end up reaching the wrong people. Instead of helping, your observability stack turns into a distraction. It has lots of data, but no clear context.

Coroot v1.9: Kubernetes-Native Database Monitoring Made Easy

From day one, we built Coroot to work beyond just Kubernetes. Many teams still run databases and other stateful services on dedicated VMs or bare-metal servers. But that’s starting to change. More and more teams no longer see Kubernetes as a platform just for stateless apps. Powerful Kubernetes operators now handle day-2 operations like failover, backups, and disaster recovery—making it easier than ever to run databases on Kubernetes. And the number of teams choosing this path keeps growing.

Monitoring database exposure on Kubernetes and VMs

This week, security researchers at Wiz published a report about an internal database at DeepSeek being exposed to the internet. This kind of security risk is surprisingly common and can affect any company. The only way to prevent it is through continuous monitoring. But in modern infrastructures, services can be exposed in many different ways, making detection tricky. At Coroot, we realized that the telemetry data we already collect can help identify these risks — without requiring any extra setup.