Operations | Monitoring | ITSM | DevOps | Cloud

Latest Posts

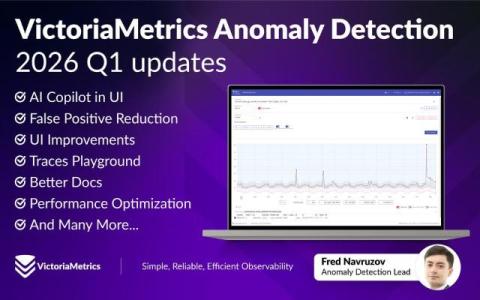
VictoriaMetrics Anomaly Detection: What's New in H1 2024?

With this blog post, we are excited to introduce a quarterly “What’s New” series to inform a broader audience about the latest features and improvements made to VictoriaMetrics Anomaly Detection (or simply vmanomaly). This first post will cover both Q1 and Q2 of 2024. Stay tuned for the next content on anomaly detection.

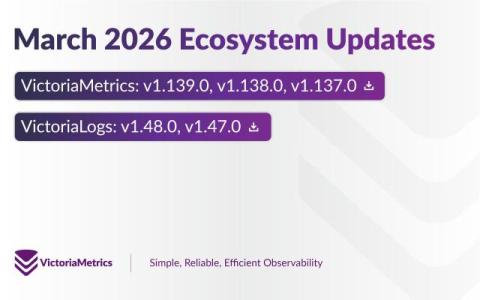
Q2 2024 Round Up: VictoriaMetrics & VictoriaLogs Updates

Many thanks to everyone who joined us for our recent virtual meetup, during which we discussed some of our Q2 2024 highlights, including features highlights, the 2024 roadmap for VictoriaMetrics and all the latest news on VictoriaLogs! In this blog post, we’d like to share a summary of these highlights.

Introduction to Managed Monitoring

Monitoring, in the context of software, is a catch-all term for visibility into infrastructure, or an application. It can encompass metrics, logs, traces, and any other telemetry data that provides information on a running application, server, or another device. Monitoring helps you catch problems before your customers do and speeds up the time to resolution for any problems that do slip through. Managed monitoring is where another company runs part or all of your monitoring system.

How to reduce expenses on monitoring: be smarter about data

Monitoring can get expensive due to the huge quantities of data that need to be processed. In this blog post, you’ll learn the best ways to store and process monitoring metrics to reduce your costs, and how VictoriaMetrics can help. This blog post will only cover open-source solutions. VictoriaMetrics is proudly open source. You’ll get the most out of this blog post if you are familiar with Prometheus, Thanos, Mimir or VictoriaMetrics.

VictoriaMetrics slashes data storage bills by 90% with world's most cost-efficient monitoring

We’re happy to share customer research today demonstrating that VictoriaMetrics is the world’s most cost-efficient monitoring solution! The real-world results show customers can save energy costs and achieve Net Zero carbon compliance faster with VictoriaMetrics in their tech stack.

How ilert Can Help Enhance Your Monitoring With Its VictoriaMetrics Integration

The ilert team have been working on an integration of VictoriaMetrics as part of their offering, and we’re happy to share this news today via this joint blog post. Please read on to learn more about ilert and how this new integration of VictoriaMetrics can help enhance your monitoring.

Comparing Performance and Resource Usage: Grafana Agent vs. Prometheus Agent Mode vs. VictoriaMetrics vmagent

Monitoring and observability are critical components of modern IT infrastructures, enabling organizations to gain insights into the performance, health, and security of their systems. Agents play a crucial role in gathering and forwarding telemetry from various sources to observability platforms.

VictoriaMetrics Machine Learning takes monitoring to the next level

Today we’re happy to announce our new VictoriaMetrics Anomaly Detection solution, which harnesses machine learning to make database alerts more relevant, accurate and actionable for enterprise customers. VictoriaMetrics Anomaly Detection lightens the load on overworked data engineers, focusing their scarce resources on the alerts that matter most to their organization.

How to reduce expenses on monitoring: Swapping in VictoriaMetrics for Prometheus

Monitoring can get expensive due to the huge quantities of data that need to be processed. In this blog post, you’ll learn the best ways to store and process monitoring metrics to reduce your costs, and how VictoriaMetrics can help. This blog post will only cover open-source solutions. VictoriaMetrics is proudly open source. You’ll get the most out of this blog post if you are familiar with Prometheus, Thanos, Mimir or VictoriaMetrics.