Operations | Monitoring | ITSM | DevOps | Cloud

Synthetic Monitoring Is Broken. Your Production Traffic Can Fix It.

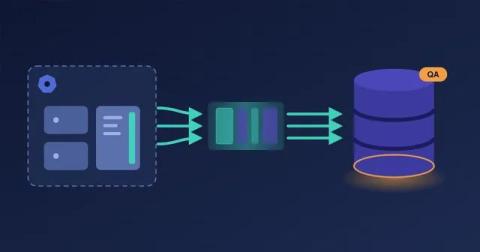
Synthetic monitoring has been a critical part of application reliability for years. It gives engineering and operations teams a way to proactively test applications, APIs, and critical customer journeys before users encounter problems. But there is a fundamental limitation with the traditional approach: Someone has to create the tests. As applications become more distributed and customer journeys become more complex, organizations can end up maintaining hundreds or even thousands of synthetic scripts.

Observe Opaque Services With OpenTelemetry eBPF + proxymock

Every SRE team operates services it cannot see into: a vendor binary, an inherited legacy deployment, a container whose owning team dissolved two reorgs ago. The routes are undocumented, the dependencies are unknown, and when a request takes 130 milliseconds nobody can say whether that time is application work or a wait across a network boundary.
Sponsored Post

Flamegraphs Find It. Replay Proves It.

I made an API endpoint 13 times faster. Then I realized my first verification only checked the status, headers, and response schema. I had not checked the totals. I had made the bug faster. That is the problem with giving an AI coding agent one kind of evidence. A CPU profile can show where the application is slow, but not whether an optimization preserves behavior. A traffic replay can prove that behavior stayed stable, but not explain why the code burns CPU. This walkthrough gives the agent two independent witnesses: Together, they turn AI code verification into an experiment with two independent checks.

The Pod Was Cheaper. The Service Wasn't.

A smaller Kubernetes pod can lower allocation cost while completing less work. Green status codes and matching schemas can hide it. This walkthrough combines OpenCost allocation data with proxymock behavior and performance evidence. A candidate passes only when behavior and throughput hold while unit cost falls.

Diagnose Serial N+1 API Calls With Tempo + proxymock

One API request took 302 milliseconds. Nothing failed. CPU was mostly idle. The response was correct. The trace made the problem obvious: eight inventory calls, each waiting for the previous one. But the trace could not tell me why the application made eight calls, or whether changing their execution would preserve the response. It showed the shape of the wait, not the input that created it.

eBPF: Preventing Garbage HTTP Payloads When Reading Kernel Scatter-Gather Buffers

Recently someone on our team opened a traffic snapshot and found an HTTP request that was captured with our eBPF capture agent, nettap. Our protocol dissector parsed most of the response correctly, but that correctness ended once the response headers were processed. What they ended up with was a recording of an HTTP request/response where the response body was just an incorrect collection of garbage binary data when it should have been JSON text.

Two confident fixes missed this production bug

Every new signup posts a message to our Slack. The format is dull and reliable: Overnight this week one arrived like this: That trailing nothing was the entire incident. No error logs, no alerts. A returning user had signed up, our signup service had attached them to a tenant we deprovisioned back in December, and the only symptom in the whole company was a Slack message that ran out of words.

Imaginary Test Data. Real Token Bill.

Ask an AI for K-pop concert advice without saying the group, city, date, or budget. It may confidently send you to a BLACKPINK tribute night in Cleveland with a $400 resale ticket. The AI was plenty confident. It just had nothing real to go on. That is exactly what happens when developers test AI applications with invented traffic. The test may look reasonable. The result may even pass.