Operations | Monitoring | ITSM | DevOps | Cloud

How to set up home automation: A beginner's guide with Grafana Cloud and Home Assistant

I first learned about Home Assistant when my previous job’s manager shared that he charms his wife by using home automation to have Alexa announce the weather as she starts getting ready for the day. After that, he showed us the cool Grafana dashboards where he visualizes his entire home automation setup on a screen in his basement. As fate would have it, I got a chance to work for Grafana Labs soon after that, and I started building my own home automation setup using Grafana Cloud.

Monitor Amazon EC2: key metrics for instances, regions, and more in one view

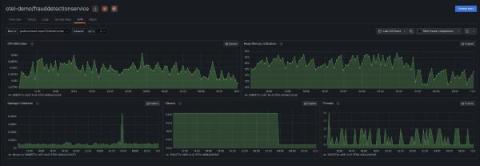
Amazon EC2 was one of the first services available on AWS, helping propel the cloud platform into the mainstream of IT. And while EC2 instances come in a wide range of sizes and flavors to address all sorts of use cases, keeping tabs on those instances isn’t always easy. That’s why we’re excited to introduce our new EC2 monitoring solution in Grafana Cloud.

Observability trends and predictions for 2024: CI/CD observability is in. Spiking costs are out.

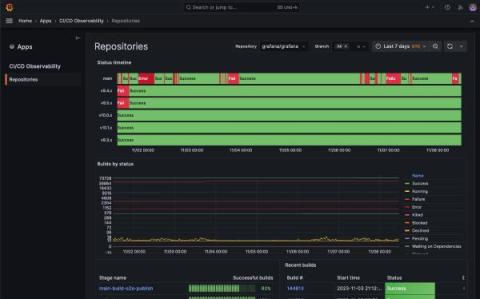
From AI to OTel, 2023 was a transformative year for open source observability. While the advancements we made in open source observability will be a catalyst for our continued work in 2024, there is even more innovation on the horizon. We asked seven Grafanistas to share their predictions for which observability trends are on their “In” list for 2024. Here’s what they had to say.

Grafana 10.2.3 release: new features and breaking changes

On Dec. 18, 2023, we unintentionally introduced some new features and two minor breaking changes in the Grafana 10.2.3 patch release. These changes were originally intended for Grafana 10.3, which we plan to release later this month, but these commits were merged into the 10.2.3 release branch early due to a mistake in our release process. Because Grafana 10.2.3 introduces more changes than expected in a typical patch release, there’s a risk of more bugs than expected.

The concise guide to Loki: How to work with out-of-order and older logs

For this week’s installment of “The concise guide to Loki,” I’d like to focus on an interesting topic in Grafana Loki’s history: ingesting out-of-order logs. Those who’ve been with the project a while may remember a time when Loki would reject any logs that were older than a log line it had already received. It was certainly a nice simplification to Loki’s internals, but it was also a big inconvenience for a lot of real world use cases.

How to create alerts to monitor sensor data with Grafana, Prometheus, and Telegram

When monitoring sensor data, such as data from a weather station, a home security system, or a home automation assistant, it’s useful to have an alerting system in place, as well. By setting up alerts for sensor data, you can automatically receive notifications when any significant event occurs — whether that’s someone arriving at your front door or a thunderstorm rolling in.

A comparison of InfluxQL, SQL, and Flux query languages for Grafana dashboards

Grant Pinkos manages two businesses near Detroit, Michigan. He enjoys Industrial IoT, Industry 4.0, guitar solos, and Pomeranians, and holds a BS in engineering and an MBA. Grant is a Grafana Champion and is very active in community discussions. He has also presented at GrafanaCON and authored a tutorial.

The concise guide to Loki: How to get the most out of your query performance

Thanks for joining me for Part 3 of “The concise guide to Grafana Loki,” a series of blog posts that takes a closer look at best practices for various aspects of using the log aggregation system. Today’s post is my holiday present for all the folks out there running Loki who would like to get the most query performance they can out of their cluster.

How to integrate Grafana Alerting and Telegram

Grafana Alerting helps you identify issues almost immediately after they occur — and you don’t have to constantly check your system to get the insights you need. Instead, Grafana Alerting sends alert notifications to reach you wherever you are, whether that’s in a Slack channel or in a messaging app like Telegram. Telegram is a viable option for receiving alerts, especially when you want personal or individual notifications rather than those sent to a team.

Grafana dashboards in 2023: Memorable use cases of the year

As the number of Grafana users grows each year, so does the variety of reasons people are using Grafana dashboards. During 2023, members of the our community — both inside and outside of the company — shared some of their incredible professional and personal projects, including how Grafana has allowed them to successfully launch a rocket, cut back on carbon emissions, and even help balance a national power grid.