Operations | Monitoring | ITSM | DevOps | Cloud

January 2019

timeShift(GrafanaBuzz, 1w) Issue 77

We’ve added more info on the upcoming talks at GrafanaCon LA and are excited to see the schedule shaping up. Grab your ticket while the last and join us February 25-26 for two days of great talks and hands-on workshops. This week we’re happy to share articles on how to view Azure Monitor Log Analytics data in Grafana, a proof of concept to visualize Fitbit data, how to quickly get up and running with Prometheus and more.

timeShift(GrafanaBuzz, 1w) Issue 74

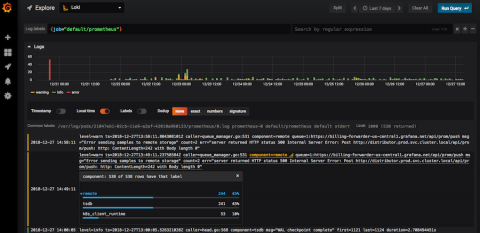
Happy New Year! We hope you had a relaxing and safe holiday season, but now it’s time to get back to work! This week we share articles on the UX of Loki, visualizing pull request data from BitBucket, monitoring and observability predictions for 2019 and more! Also, we’ll be making some exciting announcements for GrafanaCon in the coming days, so stay tuned and get your ticket now!