Operations | Monitoring | ITSM | DevOps | Cloud

October 2024

Relational Fields: Query Even More Relationships in Your Traces

Earlier this year, we introduced relational fields. Relational fields enable you to query spans based on their relationship to one other within a trace, rather than only in isolation. We’ve now expanded this feature and introduced four new prefixes: child., none., any2., and any3.. Previously, you could use root., parent., and any. to query on the root span of your target span’s trace, the parent span of your target span, and any other span in the same trace as your target span.

Driving Multi-Region Observability Excellence at Lansweeper

Since its inception in 2004, Lansweeper has been at the forefront of helping businesses understand, manage, and protect their IT devices and networks through a powerful IT asset management platform. As the platform grew from an on-premises solution to a cloud-based SaaS offering, Lansweeper expanded its reach to a global, multi-region customer base.

Tame Your Telemetry: Introducing the Honeycomb Telemetry Pipeline

Observability means you know what’s happening in your software systems, because they tell you. They tell you with telemetry: data emitted just for the people developing and operating the software. You already have telemetry–every log is a data point about something that happened. Structured logs or trace spans are even better, containing many pieces of data correlated in the same record. But you want to start from what you have, then improve it as you improve the software.

Determining a CoPE's Efficacy-and Everything After

As discussed in the first article in this series, a Center of Production Excellence (CoPE) is a more or less formal, provisional subsystem within an organization. Its purpose is to act from within to change that organization so that it’s more capable of achieving production excellence. The series has, to date, focused mainly on how best to construct such a subsystem and what activities it should pursue.

Debugging Kubernetes Autoscaling with Honeycomb Log Analytics

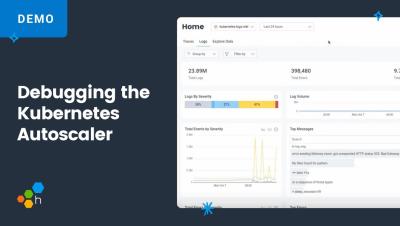
Let’s be real, we’ve never been huge fans of conventional unstructured logs at Honeycomb. From the very start, we’ve emitted from our own codestructured wide events and distributed traces with well-formed schemas. Fortunately (because it avoids reinventing the wheel) and unfortunately (because it doesn’t adhere to our standards for observability) for us, not all the software we run is written by us.

Unlock the Real Value of Logs With Honeycomb Telemetry Pipeline and Honeycomb for Log Analytics

At Honeycomb, we know how important it is for organizations to have a unified observability platform. This is why we’re launching Honeycomb Telemetry Pipeline and Honeycomb for Log Analytics: to enable engineering teams to send and analyze data—including logs—into a single, unified platform. For too long, teams have had to wrangle large volumes of logs, their context scattered across multiple teams and tools, leading to knowledge silos.

Frontend Observability: A Candid Conversation With Emily Nakashima and Charity Majors

Frontend development has evolved rapidly over the past decade, but one challenge remains constant: understanding what’s happening in real-time across diverse browsers, environments, and user interactions. This is where observability steps in—but how does it apply to the frontend world where user experience can break in countless, unexpected ways?

Redefining RUM: A Comparative Gap Analysis of Existing Tools

Real user monitoring (RUM) began as a straightforward approach to tracking basic web performance metrics. Focused on things like page load times and response rates, RUM relied on server-side logging and simple browser timings. While these tools captured Core Web Vitals (CWVs), they offered limited insights into how users actually interacted with pages, focused mainly on server-side performance.

Using Honeycomb for Frontend Observability to Improve Honeycomb

Recently, we announced the launch of Honeycomb for Frontend Observability, our new solution that helps frontend developers move from traditional monitoring to observability. What this means in practice is that frontend developers are no longer limited to a metrics view of their app that can only be disaggregated in a few dimensions. Now, they can enjoy the full power of observability, where their app collects a broad set of data as traces to enable much richer analysis of the state of a web service.

Refinery and EMA Sampling

Refinery is Honeycomb’s sampling proxy, which our largest customers use to improve the value they get from their telemetry. It has a variety of interesting samplers to choose from. One category of these is called dynamic sampling. It’s basically a technique for adjusting sample rates to account for the volume of incoming data—but doing so in a way that rare events get more priority than common events. Honeycomb’s query engine can compensate for sampling rates on a per-event basis.