Operations | Monitoring | ITSM | DevOps | Cloud

February 2020

How to create maintainable and reusable Logstash pipelines

Logstash is an open source data processing pipeline that ingests events from one or more inputs, transforms them, and then sends each event to one or more outputs. Some Logstash implementations may have many lines of code and may process events from multiple input sources. In order to make such implementations more maintainable, I will show how to increase code reusability by creating pipelines from modular components.

The advantages of resource-based pricing in security

Given the complexity of large enterprise environments, coupled with the diversity of the vendor landscape, there is no single, agreed-upon “best” way to buy security. The battles continue between CAPEX or OPEX, net-30 or net-90, annual or multi-year, perpetual or subscription. One thing we do know, however, is that all too often the consumer pays for something he or she does not use.

Discovering anomalous patterns based on parent-child process relationships

As antivirus and machine learning-based malware detection have increased their effectiveness in detecting file-based attacks, adversaries have migrated to “living off the land” techniques to bypass modern security software. This involves executing system tools preinstalled with the operating system or commonly brought in by administrators to perform tasks like automating IT administrative tasks, running scripts on a regular basis, executing code on remote systems, and much more.

Elastic on Elastic: Securing our endpoints with Elastic Security

This blog post is one in an occasional series about how we at Elastic embrace our own technology. The Elastic InfoSec team is responsible for securing Elastic and responding to threats. We use our products everywhere we can — and for more than just logs. By harnessing the power and breadth of capabilities of the Elastic Stack, we are working on tracking risk and performance metrics, threat intelligence, our control framework, and control conformance information within Elastic.

Mac system extensions for threat detection: Part 3

This is the third and final post of a three-part series on understanding kernel extension frameworks for Mac systems. In part 1, we reviewed the existing kernel extension frameworks and the information that these frameworks can provide. In part 2 we covered techniques that could be used in kernel to gather even more details on system events. In this post, we will go into the new EndpointSecurity and SystemExtensions frameworks.

Is it a good time(stamp) for centralized logging?

With almost all deployed software systems consisting of multiple moving parts, it’s hard to find arguments against centralized aggregation of log entries. Deployment technologies like lightweight virtualization, Kubernetes, and serverless computing tend to spread out the components of a system across a large number of runtime primitives. Gaining visibility into the state and history of such systems is as important as ever but can also be more difficult than ever.

Playing defense against Gamaredon Group

For several months, the Intelligence & Analytics team at Elastic Security has tracked an ongoing adversary campaign appearing to target Ukranian government officials. Based on our monitoring, we believe Gamaredon Group, a suspected Russia-based threat group, is behind this campaign. Our observations suggest a significant overlap between tactics, techniques, and procedures (TTPs) included within this campaign and public reporting.

Elastic partners with DDC to offer free election security to 2020 campaigns

We are excited to announce that Elastic will offer free, monitored Elastic Endpoint Security to the 2020 US presidential and congressional campaigns in partnership with Defending Digital Campaigns. Defending Digital Campaigns (DDC) is a non-partisan organization that provides low- and no-cost security products and services to federal campaigns to help defend them from cyberattacks and election interference.

Multilingual search using language identification in Elasticsearch

We’re pleased to announce that along with the release of the machine learning inference ingest processor, we are releasing language identification in Elasticsearch 7.6. With this release, we wanted to take the opportunity to describe some use cases and strategies for searching in multilingual corpora, and how language identification plays a part. We’ve covered some of these topics in the past, and we’ll build on these in some of the examples that follow.

How to upgrade Elastic App Search

We highly recommend that all App Search users keep their deployments up to date with the latest available version to have access to new features, security updates, and performance improvements. This guide is designed to help customers through the upgrade process, to minimize the impact of an upgrade on production environments, and to ensure data safety during an upgrade. Finally, the guide helps App Search users troubleshoot any issues that may occur during an upgrade.

Elastic Stack 7.6.0 released

We are excited to announce the general availability of version 7.6 of the Elastic Stack. This release streamlines automated threat detection with the launch of a new SIEM detection engine and a curated set of detection rules aligned to the MITRE ATT&CK™ knowledge base, brings performance improvements to Elasticsearch, makes supervised machine learning more turnkey with inference-on-ingest features, and deepens cloud observability and security with the launch of new data integrations.

Migrating from Splunk to the Elastic Stack: Data migration

When Splunk was first released almost 20 years ago, it helped many organizations realize the power of logs to gain business insights with pricing based on the volume of data ingested per day. Over the last two decades, the volume, variety, and velocity of data generated by systems and users have grown exponentially. The demands of business and operations have quickly moved beyond compliance and basic reporting.

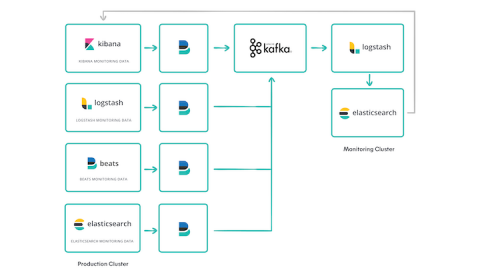
Elastic Stack monitoring with Metricbeat via Logstash or Kafka

In a previous blog post, we introduced a new method of monitoring the Elastic Stack with Metricbeat. Using Metricbeat to externally collect monitoring information about Elastic Stack products improves the reliability of monitoring those products. It also provides flexibility with how the monitoring data may be routed to the Elasticsearch monitoring cluster.

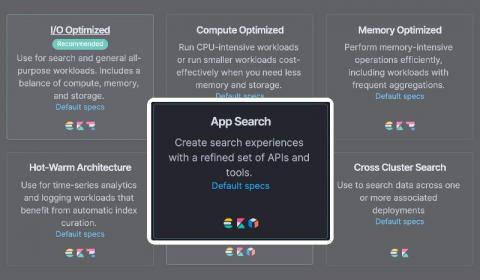
Getting started with Elastic App Search on Elastic Cloud

With Elastic App Search, you can easily add rich, powerful search to your website, applications, or mobile apps. And now you can deploy directly from the Elastic Cloud. App Search is built on top of Elasticsearch, meaning that it’s highly scalable and fast. It comes out of the box with pre-tuned relevance, but gives you plenty of user-friendly options for fine-tuning results to customize the search experience.

Elastic App Search: Now available on Elasticsearch Service

We're excited to announce that Elastic App Search is now generally available on Elasticsearch Service. App Search is a ready-to-use, fully complete search solution with user-friendly relevance tuning and analytics built in. And starting today, you can deploy App Search instances with the click of a button right from the Elasticsearch Service dashboard. Now you can get all the tooling needed for a powerfully relevant search experience with the operational flexibility and scale of Elastic Cloud.